Graph Cash-on-Hand Tomorrow, Value, Policy given (A,Z) States Today
back to Fan's Dynamic Assets Repository Table of Content.
Contents
function ff_az_vf_post_graph(varargin)
FF_AZ_VF_POST_GRAPH genereate 4 graphs
Generates four graphs:
- Cash-On-Hand Tomorrow given Cash-on-Hand Today
- Value Function Graph
- Policy Function Consumption and Asset Choices, Level and log
- Consumption and Asset as Percentages
Run this function directly with randomly generates matrixes for graphs and tables.
@param param_map container parameter container
@param support_map container support container
@param armt_map container container with states, choices and shocks grids that are inputs for grid based solution algorithm
@param result_map container contains policy function matrix, value function matrix, iteration results; als coh consumption and other matrixes
@example
ff_az_vf_post_graph(param_map, support_map, armt_map, func_map, result_map);
@include
Default
if (~isempty(varargin))
    % if invoked from outside overrid fully
    [param_map, support_map, armt_map, func_map, result_map] = varargin{:};
else
    clear all;
    close all;

    % internal invoke for testing
    it_param_set = 4;
    bl_input_override = true;

    % Get Parameters
    [param_map, support_map] = ffs_az_set_default_param(it_param_set);
    [armt_map, func_map] = ffs_az_get_funcgrid(param_map, support_map, bl_input_override); % 1 for override

    % Generate Default val and policy matrixes
    params_group = values(armt_map, {'ar_a', 'ar_z'});
    [ar_a, ar_z] = params_group{:};
    params_group = values(func_map, {'f_util_standin', 'f_cons', 'f_coh'});
    [f_util_standin, f_cons, f_coh] = params_group{:};

    % Set Defaults
    mt_val = f_util_standin(ar_z, ar_a');
    mt_pol_a = zeros(size(mt_val)) + ar_a'*(cumsum(sort(ar_z))/sum(ar_z)*0.4 + 0.4);
    mt_cons = f_cons(ar_z, ar_a', mt_pol_a);
    mt_coh = f_coh(ar_z, ar_a');

    % Set Results Map
    result_map = containers.Map('KeyType','char', 'ValueType','any');
    result_map('mt_val') = mt_val;
    result_map('cl_mt_pol_a') = {mt_pol_a, zeros(1)};
    result_map('cl_mt_pol_c') = {mt_cons, zeros(1)};
    result_map('cl_mt_coh') = {mt_coh, zeros(1)};
end
Parse Parameters
% param_map
params_group = values(param_map, {'st_model', 'it_z_n'});
[st_model, it_z_n] = params_group{:};

% support_map
params_group = values(support_map, {'bl_graph_onebyones', 'bl_graph_val', 'bl_graph_pol_lvl', 'bl_graph_pol_pct', 'bl_graph_coh_t_coh'});
[bl_graph_onebyones, bl_graph_val, bl_graph_pol_lvl, bl_graph_pol_pct, bl_graph_coh_t_coh] = params_group{:};
params_group = values(support_map, {'bl_img_save', 'st_img_path', 'st_img_prefix', 'st_img_name_main', 'st_img_suffix'});
[bl_img_save, st_img_path, st_img_prefix, st_img_name_main, st_img_suffix] = params_group{:};
params_group = values(support_map, {'st_title_prefix'});
[st_title_prefix] = params_group{:};

% armt_map
params_group = values(armt_map, {'ar_a'});
[ar_a] = params_group{:};
if (ismember(st_model, ["abz"]))
    params_group = values(armt_map, {'ar_z_r_borr_mesh_wage', 'ar_z_wage_mesh_r_borr'});
    [ar_z_r_borr_mesh_wage, ar_z_wage_mesh_r_borr] = params_group{:};
    params_group = values(param_map, {'it_z_wage_n', 'fl_z_r_borr_n'});
    [it_z_wage_n, fl_z_r_borr_n] = params_group{:};
elseif (ismember(st_model, ["abzr_fibs"]))
    params_group = values(armt_map, {'ar_z_r_infbr_mesh_wage', 'ar_z_wage_mesh_r_infbr'});
    [ar_z_r_borr_mesh_wage, ar_z_wage_mesh_r_borr] = params_group{:};
    params_group = values(param_map, {'it_z_wage_n', 'fl_z_r_infbr_n'});
    [it_z_wage_n, fl_z_r_borr_n] = params_group{:};
else
    params_group = values(armt_map, {'ar_z'});
    [ar_z] = params_group{:};
end

% func_map
params_group = values(func_map, {'f_coh'});
[f_coh] = params_group{:};

% result_map
params_group = values(result_map, {'mt_val', 'cl_mt_pol_c', 'cl_mt_coh', 'cl_mt_pol_a'});
[mt_val, cl_mt_pol_c, cl_mt_coh, cl_mt_pol_a] = params_group{:};
[mt_cons, mt_coh, mt_pol_a] = deal(cl_mt_pol_c{1}, cl_mt_coh{1}, cl_mt_pol_a{1});

% How many zs to Graph
Generate Limited Legends
if (ismember(st_model, ["abz", "abzr_fibs"]))

    % 8 graph points, 2 levels of borrow rates, and 4 levels of rbr rates
    ar_it_z_r_borr = ([1 round((fl_z_r_borr_n)/2) (fl_z_r_borr_n)]);
    ar_it_z_wage = ([1 round((it_z_wage_n)/2) (it_z_wage_n)]);

    % combine by index
    mt_it_z_graph = ar_it_z_wage' + it_z_wage_n*(ar_it_z_r_borr-1);
    ar_it_z_graph = mt_it_z_graph(:)';

    % legends index final
    ar_it_legend2plot = fliplr(ar_it_z_graph);
    ar_it_legend2plot_lth = ar_it_z_graph;
    cl_st_legendCell = cellstr([num2str(ar_z_r_borr_mesh_wage', 'zr=%3.2f;'), ...
                          num2str(ar_z_wage_mesh_r_borr', 'zw=%3.2f')]);
else
    ar_it_z_graph = ([1 round((it_z_n)/4) round(2*((it_z_n)/4)) round(3*((it_z_n)/4)) (it_z_n)]);
    ar_it_legend2plot = fliplr(ar_it_z_graph);
    ar_it_legend2plot_lth = ar_it_z_graph;
    cl_st_legendCell = cellstr(num2str(ar_z', 'shock next=%3.2f'));
end
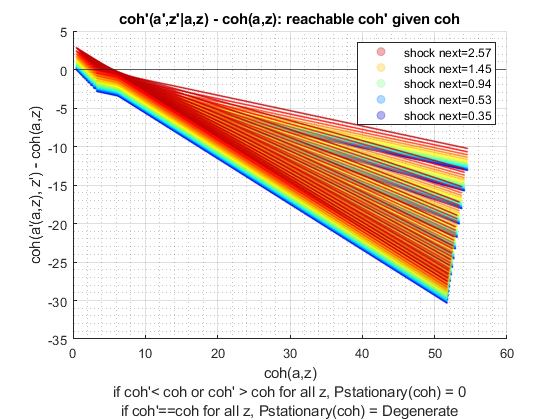
Graphing COH today vs COH tomorrow
This plots the cash-on-hand today vs cash-on-hand tomorrow. This is an important graph that is key for analyzing the asset distribution. We would like to see at each point of the current cash-on-hand, what are the cash-on-hand that are reachable tomorrow. Note, here we are not plottin gbased on probability density for each discretized state tomorrow, just which states are reacable, meaning which states given states have non-zero probability of been reached tomorrow.
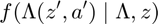
Three possible cases:
- next period cash-on-hand is always lower than current period cash-on-hand given policy function. This means it is not possible to exceed beyond this level of cash-on-hand in the stationary distribution. If we start mass lower than this level of cash-on-hand, it will never exceed this.
- next period cash-on-hand is always higher than current period cash-on-hand. Stationary distribution will never go below this level.
- next period cash-on-hand is identical to today cash on hand. This is an absorbing state.
The dimensionality of the graph is as follows:
- a_n by z_n state space and corresonding policy function
- all a_n and z_n combinations, one array, policy array, than given that, the cash-on-hand next period. meshed a_n and z_n with each other, crossed with another z_n.
- each color a different future z_n
if (bl_graph_coh_t_coh)

    % 1. Single Array A' Next Period and COH today
    ar_pol_a_full = mt_pol_a(:);
    ar_coh_full = mt_coh(:);

    % 2. COH Next Period
    if (ismember(st_model, ["abz"]))
        mt_coh_next = f_coh(ar_z_r_borr_mesh_wage, ar_z_wage_mesh_r_borr, ar_pol_a_full);
    elseif (ismember(st_model, ["abzr_fibs"]))
        mt_coh_next = f_coh(ar_z_wage_mesh_r_borr, ar_pol_a_full);
    else
        mt_coh_next = f_coh(ar_z, ar_pol_a_full);
    end


    % 3. Start Figure
    if(~bl_graph_onebyones)
        figure('PaperPosition', [0 0 21 4]);
        ar_sub_j = 1:1:3;
    else
        ar_sub_j = [3 2];
    end

    for sub_j = ar_sub_j

        % 4. Legends and values
        if (ismember(sub_j, [2]))
            bl_log_coh = 1;
        else
            bl_log_coh = 0;
        end

        if (sub_j==1)

            mt_outcome = mt_coh_next;
            ar_xvar = ar_coh_full;

            st_y_label = 'cash-on-hand t+1 = coh(a''(a,z), z'')';
            st_x_label = 'cash-on-hand t = coh(a,z)';
            st_title = 'coh(a''(coh(a,z),z), z''): reachable coh'' given coh';
            st_legend_loc = 'southeast';

        end
        if (sub_j==2)

            mt_outcome = log(mt_coh_next - min(ar_a) + 1);
            ar_xvar = log(ar_coh_full - min(ar_a) + 1);

            st_y_label = 'log(coh''(a'',z'') - min(a'') + 1)';
            st_x_label = 'log(coh(a,z) - min(a) + 1)';
            st_title = 'coh(a''(coh(a,z),z), z''): reachable coh'' given coh';
            st_legend_loc = 'southeast';

        end
        if (sub_j==3)

            mt_outcome = mt_coh_next - ar_coh_full;
            ar_xvar = ar_coh_full;

            st_y_label = 'coh(a''(a,z), z'') - coh(a,z)';
            st_x_label = 'coh(a,z)';
            st_title = 'coh''(a'',z''|a,z) - coh(a,z): reachable coh'' given coh';
            st_legend_loc = 'northeast';

        end

        % 5. Start Figure
        if (~bl_graph_onebyones)
            subplot(1,3,sub_j)
        else
            figure('PaperPosition', [0 0 7 4]);
        end
        hold on;

        % 7. Color
        clr = jet(it_z_n);
        for m = 1:it_z_n
            % scatter
            mt_y = real(mt_outcome(:,m));
            ar_x = real(ar_xvar);
            fig_cur_z = scatter(ar_x, mt_y, 1, ...
                'MarkerEdgeColor', clr(m,:), 'MarkerFaceAlpha', 0.3, ...
                'MarkerFaceColor', clr(m,:), 'MarkerEdgeAlpha', 0.3);
            chart(m) = fig_cur_z;
        end

        % 8. Legends
        legend(chart(ar_it_legend2plot), cl_st_legendCell(ar_it_legend2plot), 'Location', st_legend_loc);

        % 9. Titling etc
        grid on;
        title([st_title_prefix st_title]);
        ylabel(st_y_label);
        xlabel({st_x_label ...
                'if coh''< coh or coh'' > coh for all z, Pstationary(coh) = 0', ...
                'if coh''==coh for all z, Pstationary(coh) = Degenerate'})
        if (bl_log_coh == 0)
            xline0 = xline(0);
            xline0.HandleVisibility = 'off';

            yline0 = yline(0);
            yline0.HandleVisibility = 'off';
        else
            xline0 = xline(log(0 - min(ar_a) + 1));
            xline0.HandleVisibility = 'off';

            yline0 = yline(log(0 - min(ar_a) + 1));
            yline0.HandleVisibility = 'off';
        end


        % 45 Degree Line
        if (sub_j~=3)
            hline = refline([1 0]);
            hline.Color = 'k';
            hline.LineStyle = ':';
            hline.HandleVisibility = 'off';
            hline.LineWidth = 2.5;
        end

        grid on;
        grid minor;
    end

    % save file
    if (bl_img_save)
        if ~exist(support_map('st_img_path'),'dir'); mkdir(support_map('st_img_path')); end
        st_file_name = [st_img_prefix st_img_name_main '_coh' st_img_suffix];
        saveas(gcf, strcat(st_img_path, st_file_name));
    end

end
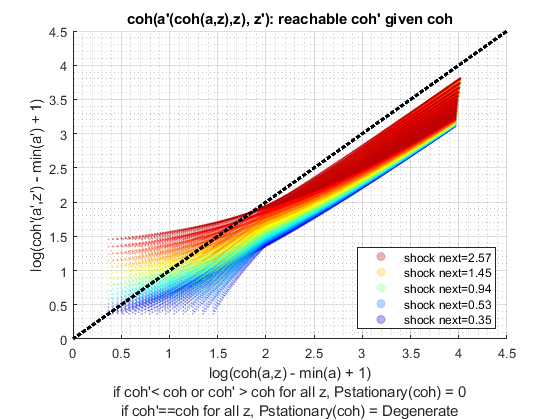
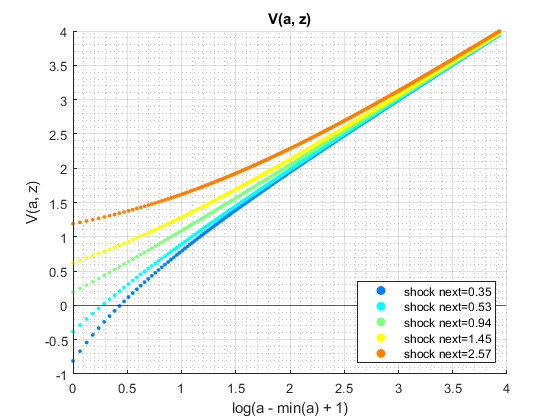
Graphing Values

if (bl_graph_val)

    if (~bl_graph_onebyones)
        figure('PaperPosition', [0 0 14 4]);
    end

    for sub_j=1:1:2

        mt_outcome = mt_val;
        st_y_label = 'V(a, z)';

        if (~bl_graph_onebyones)
            subplot(1,2,sub_j)
        else
            figure('PaperPosition', [0 0 7 4]);
        end
        hold on;

        clr = jet(length(ar_it_z_graph));
        i_ctr = 0;
        for i = ar_it_z_graph
            i_ctr = i_ctr + 1;

            if (sub_j == 1)
                ar_x = ar_a;
            else
                ar_x = log(ar_a - min(ar_a) + 1);
            end

            ar_y = mt_outcome(:, i);
            scatter(ar_x, ar_y, 5, ...
                'MarkerEdgeColor', clr(i_ctr,:), ...
                'MarkerFaceColor', clr(i_ctr,:));
        end

        grid on;
        grid minor;
        title([st_title_prefix 'V(a, z)'])
        ylabel(st_y_label)

        if (sub_j == 1)
            xlabel({'Asset (a) State'})
        else
            xlabel({'log(a - min(a) + 1)'})
        end

        % Legends
        legend(cl_st_legendCell(ar_it_legend2plot_lth), 'Location', 'southeast');

        % mark y = 0
        yline0 = yline(0);
        yline0.HandleVisibility = 'off';

        % mark a = 0
        if (sub_j == 1)
            xline0 = xline(0);
        else
            xline0 = xline(log(0 - min(ar_a) + 1));
        end
        xline0.HandleVisibility = 'off';

    end

    % save file
    if (bl_img_save)
        if ~exist(support_map('st_img_path'),'dir'); mkdir(support_map('st_img_path')); end;
        st_file_name = [st_img_prefix st_img_name_main '_val' st_img_suffix];
        saveas(gcf, strcat(st_img_path, st_file_name));
    end

end
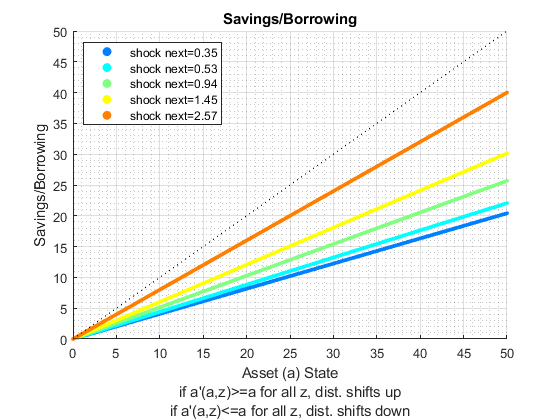
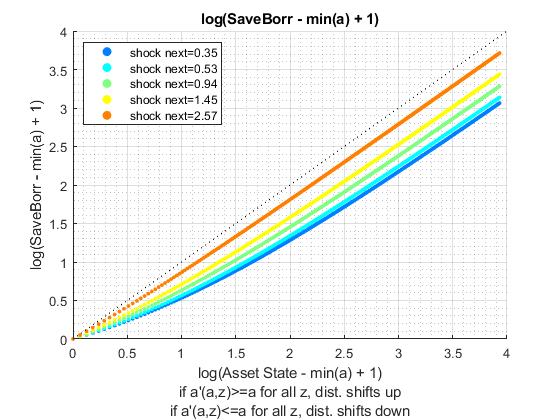
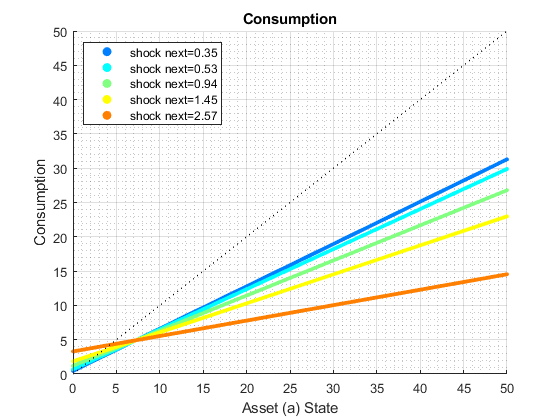
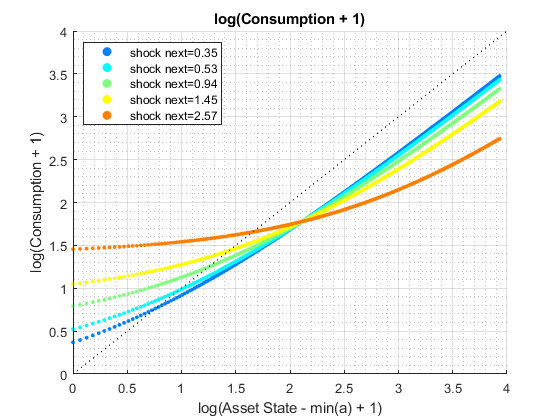
Graphing Choice Levels

if (bl_graph_pol_lvl)

    if (~bl_graph_onebyones)
        figure('PaperPosition', [0 0 14 8]);
        ar_sub_j = 1:1:4;
    else
        ar_sub_j = [1 3 2 4];
    end

    for sub_j = ar_sub_j

        if (sub_j==1 || sub_j == 3)

            % asset choice
            mt_outcome = mt_pol_a;

        end
        if (sub_j==2 || sub_j == 4)

            % consumption choice
            mt_outcome = mt_cons;

            % for borrowing models consumption could be at cmin, and next
            % period a' choice given default is a'=0, using the consumption
            % equation, this leads to not cmin but a negative consumption
            % level. so here adjust negative consumption to 0
            mt_outcome(mt_cons <0) = 0;

        end

        if (~bl_graph_onebyones)
            subplot(2,2,sub_j)
        else
            figure('PaperPosition', [0 0 7 4]);
        end
        hold on;

        clr = jet(length(ar_it_z_graph));
        i_ctr = 0;
        for i = ar_it_z_graph
            i_ctr = i_ctr + 1;
            ar_opti_curz = mt_outcome(:, i);

            if (sub_j==1 || sub_j == 2)
                % levels
                ar_a_curz_use = ar_a';
                ar_opti_curz_use = ar_opti_curz';
            elseif (sub_j==3 || sub_j == 4)
                % logs
                ar_a_curz_use = log(ar_a' - min(ar_a) + 1);
                if (sub_j==3)
                    % borrow save
                    ar_opti_curz_use = log(ar_opti_curz' - min(ar_a) + 1);
                end
                if (sub_j == 4)
                    % consumption
                    ar_opti_curz_use = log(ar_opti_curz' + 1);
                end
            end

            scatter(ar_a_curz_use, ar_opti_curz_use, 5, ...
                'MarkerEdgeColor', clr(i_ctr,:), ...
                'MarkerFaceColor', clr(i_ctr,:));
        end

        if (sub_j==1)
            st_y_label = 'Savings/Borrowing';
            st_x_label = {'Asset (a) State'...
                'if a''(a,z)>=a for all z, dist. shifts up'...
                'if a''(a,z)<=a for all z, dist. shifts down'};
        end
        if (sub_j==2)
            st_y_label = 'Consumption';
            st_x_label = 'Asset (a) State';
        end
        if (sub_j==3)
            st_y_label = 'log(SaveBorr - min(a) + 1)';
            st_x_label = {'log(Asset State - min(a) + 1)'...
                'if a''(a,z)>=a for all z, dist. shifts up'...
                'if a''(a,z)<=a for all z, dist. shifts down'};
        end
        if (sub_j==4)
            st_y_label = 'log(Consumption + 1)';
            st_x_label = 'log(Asset State - min(a) + 1)';
        end


        grid on;
        title([st_title_prefix st_y_label]);
        ylabel(st_y_label);
        xlabel(st_x_label);

        legend(cl_st_legendCell(ar_it_legend2plot_lth), 'Location', 'northwest');

        hline = refline([1 0]);
        hline.Color = 'k';
        hline.LineStyle = ':';
        hline.HandleVisibility = 'off';

        if (sub_j==3 || sub_j == 4)
            xline0 = xline(log(0-min(ar_a)+1));
            xline0.HandleVisibility = 'off';
            if (sub_j==3)
                yline0 = yline(log(0-min(ar_a)+1));
                yline0.HandleVisibility = 'off';
            end
            if (sub_j == 4)
                yline0 = yline(log(0+1));
                yline0.HandleVisibility = 'off';
            end
        else
            xline0 = xline(0);
            xline0.HandleVisibility = 'off';
            yline0 = yline(0);
            yline0.HandleVisibility = 'off';
        end
        grid on;
        grid minor;

    end

    % save file
    if (bl_img_save)
        if ~exist(support_map('st_img_path'),'dir'); mkdir(support_map('st_img_path')); end;
        st_file_name = [st_img_prefix st_img_name_main '_pol_lvl' st_img_suffix];
        saveas(gcf, strcat(st_img_path, st_file_name));
    end

end
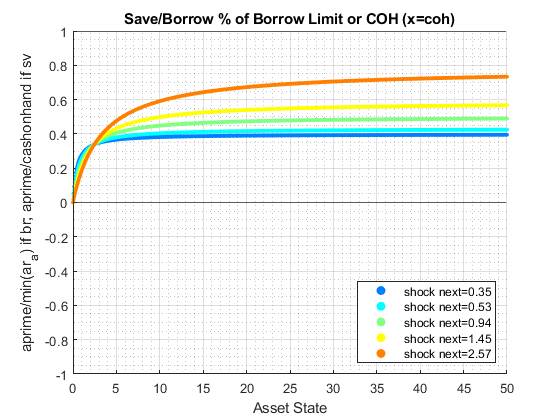
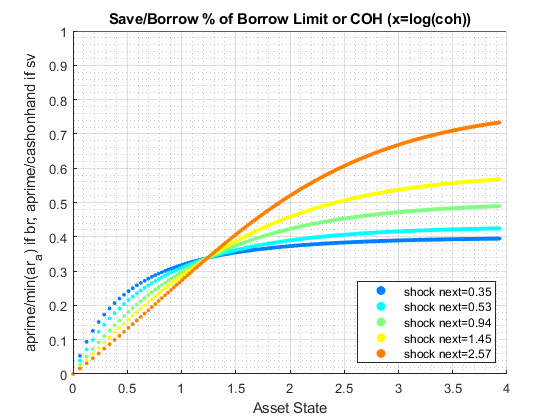
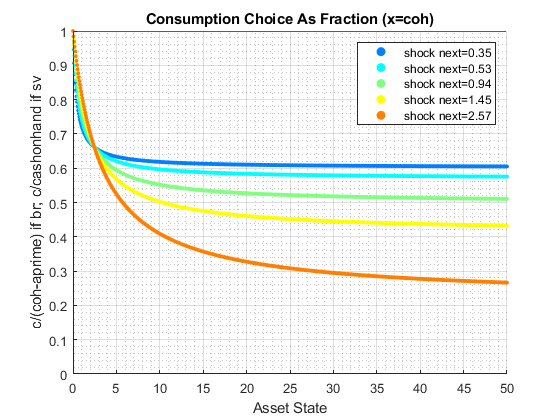
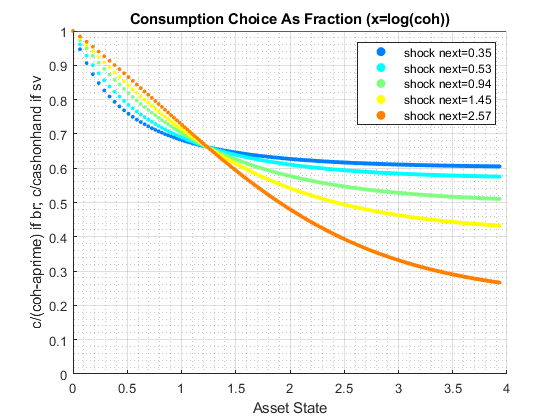
Graphing Choice Percentages
if (bl_graph_pol_pct)

    if(~bl_graph_onebyones)
        figure('PaperPosition', [0 0 14 8]);
        ar_sub_j = 1:1:4;
    else
        ar_sub_j = [1 3 2 4];
    end

    for sub_j = ar_sub_j

        mt_outcome = zeros(size(mt_pol_a));
        mt_it_borr_idx = (mt_pol_a < 0);

        if (ismember(sub_j, [1,2]))
            bl_log_coh = 0;
            st_sv_suffix = '_xcoh';
            st_title_suffix = ' (x=coh)';
        else
            bl_log_coh = 1;
            st_sv_suffix = '_logxcoh';
            st_title_suffix = ' (x=log(coh))';
        end

        if (sub_j==1 || sub_j==3)
            mt_outcome(mt_it_borr_idx) = -mt_pol_a(mt_it_borr_idx)./min(ar_a);
            mt_outcome(~mt_it_borr_idx) = mt_pol_a(~mt_it_borr_idx)./mt_coh(~mt_it_borr_idx);
            st_y_label = 'aprime/min(ar_a) if br; aprime/cashonhand if sv';
            st_legend_loc = 'southeast';
            st_title = 'Save/Borrow % of Borrow Limit or COH';
        end
        if (sub_j==2 || sub_j==4)

            mt_cons_use = mt_cons;
            mt_cons_use(mt_cons <0) = 0;

            mt_outcome(mt_it_borr_idx) = mt_cons_use(mt_it_borr_idx)./(mt_coh(mt_it_borr_idx) - mt_pol_a(mt_it_borr_idx));
            mt_outcome(~mt_it_borr_idx) = mt_cons_use(~mt_it_borr_idx)./mt_coh(~mt_it_borr_idx);
            st_y_label = 'c/(coh-aprime) if br; c/cashonhand if sv';
            st_legend_loc = 'northeast';
            st_title = 'Consumption Choice As Fraction';
        end

        if (~bl_graph_onebyones)
            subplot(2,2,sub_j)
        else
            figure('PaperPosition', [0 0 7 4]);
        end
        hold on;

        clr = jet(length(ar_it_z_graph));
        i_ctr = 0;
        for i = ar_it_z_graph

            i_ctr = i_ctr + 1;
            ar_opti_curz = mt_outcome(:, i);

            if (bl_log_coh == 0)
                ar_x = ar_a;
            else
                ar_x = log(ar_a - min(ar_a) + 1);
            end

            scatter(ar_x, ar_opti_curz, 5, ...
                'MarkerEdgeColor', clr(i_ctr,:), ...
                'MarkerFaceColor', clr(i_ctr,:));
        end

        grid on;

        title([st_title_prefix st_title st_title_suffix])
        ylabel(st_y_label)

        xlabel({'Asset State'})
        legend(cl_st_legendCell(ar_it_legend2plot_lth), 'Location', st_legend_loc);

        if (bl_log_coh == 0)
            xline0 = xline(0);
            xline0.HandleVisibility = 'off';
        else
            xline0 = xline(log(0-min(ar_a)+1));
            xline0.HandleVisibility = 'off';
        end

        yline0 = yline(0);
        yline0.HandleVisibility = 'off';
        yline0 = yline(1);
        yline0.HandleVisibility = 'off';

        % for save/borrow 100 and -100 percent
        if (sub_j==1)
            yline0 = yline(-1);
            yline0.HandleVisibility = 'off';
        end

        grid on;
        grid minor;
    end

    % save file
    if (bl_img_save)
        if ~exist(support_map('st_img_path'),'dir'); mkdir(support_map('st_img_path')); end;
        st_file_name = [st_img_prefix st_img_name_main '_pol_pct' st_img_suffix];
        saveas(gcf, strcat(st_img_path, st_file_name));
    end

end
end