Graph: Line and Related Plots
back to Fan's Reusable Matlab Codes Table of Content.
Contents
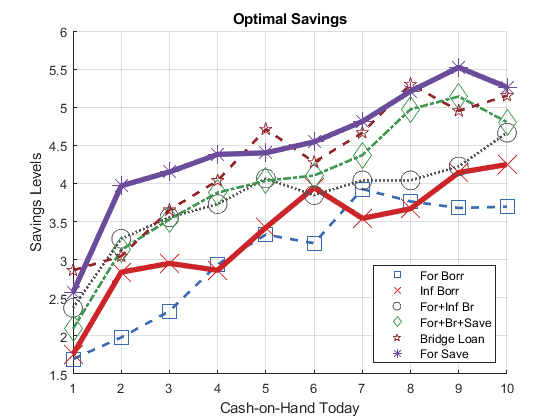
Six lines Plot
colors from optimal colors.
close all
figure();
hold on;

blue = [57 106 177]./255;
red = [204 37 41]./255;
black = [83 81 84]./255;
green = [62 150 81]./255;
brown = [146 36 40]./255;
purple = [107 76 154]./255;
cl_colors = {blue, red, black, ...
             green, brown, purple};
cl_legend = {'For Borr', 'Inf Borr', 'For+Inf Br', 'For+Br+Save', 'Bridge Loan', 'For Save'};
cl_scatter_shapes = {'s','x','o','d','p','*'};
cl_linestyle = {'--','-',':','-.','--','-'};
it_sca_bs = 20;
cl_scatter_csizes = {10*it_sca_bs, 20*it_sca_bs, 10*it_sca_bs, 10*it_sca_bs, 5*it_sca_bs, 8*it_sca_bs};
it_line_bs = 2;
cl_line_csizes = {1*it_line_bs, 2*it_line_bs, 1*it_line_bs, 1*it_line_bs, 1*it_line_bs, 2*it_line_bs};

it_x_groups_n = length(cl_scatter_csizes);
it_x_n = 10;

% Generate Random Data
rng(123);
mat_y = rand([it_x_n, it_x_groups_n]);
mat_y = mat_y + sqrt(1:it_x_groups_n);
mat_y = mat_y + log(1:it_x_n)';
ar_x = 1:1:it_x_n;

ar_it_graphs_run = 1:6;
it_graph_counter = 0;
for it_fig = ar_it_graphs_run

    % Counter
    it_graph_counter = it_graph_counter + 1;

    % Y Outcome
    ar_y = mat_y(:, it_fig)';

    % Color and Size etc
    it_csize = cl_scatter_csizes{it_fig};
    ar_color = cl_colors{it_fig};
    st_shape = cl_scatter_shapes{it_fig};
    st_lnsty = cl_linestyle{it_fig};
    st_lnwth = cl_line_csizes{it_fig};

    % plot scatter and include in legend
    ls_chart(it_graph_counter) = scatter(ar_x, ar_y, it_csize, ar_color, st_shape);

    % plot line do not include in legend
    line = plot(ar_x, ar_y);
    line.HandleVisibility = 'off';
    line.Color = ar_color;
    line.LineStyle = st_lnsty;
    line.HandleVisibility = 'off';
    line.LineWidth = st_lnwth;

    % Legend to include
    cl_legend{it_graph_counter} = cl_legend{it_fig};
end

% Legend
legend(ls_chart, cl_legend, 'Location', 'southeast');

% labeling
title('Optimal Savings');
ylabel('Savings Levels');
xlabel('Cash-on-Hand Today');
grid on;

snapnow;
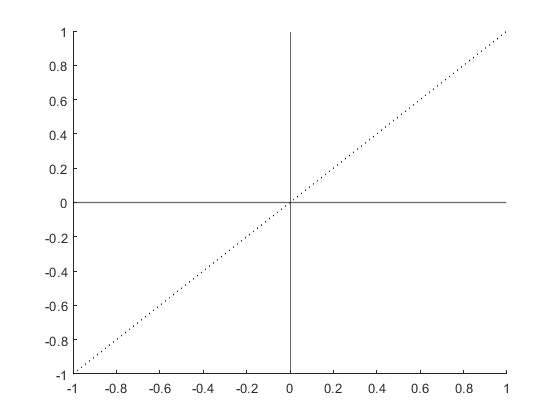
Horizontal and Vertical Lines and 45 Degree
figure();

xline0 = xline(0);
xline0.HandleVisibility = 'off';
yline0 = yline(0);
yline0.HandleVisibility = 'off';
yline0.LineWidth = 1;

hline = refline([1 0]);
hline.Color = 'k';
hline.LineStyle = ':';
hline.HandleVisibility = 'off';

snapnow

close all