Grid based Graph, x-axis one param, color another param, over outcomes
back to Fan's Dynamic Assets Repository Table of Content.
Contents
function fsi_graph_grid(varargin)
FSI_GRAPH_GRID genereate 4 graphs
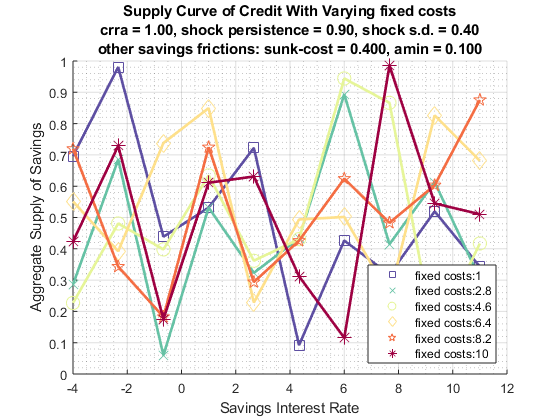
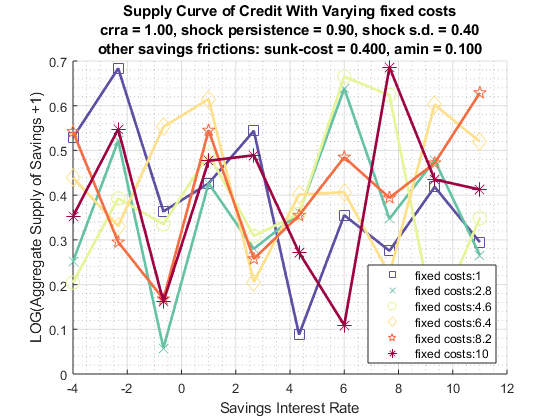
Generates graph where the x-axis is some parameter, y some outcome, and color another parameter
@param ar_color_grid array 1 by N, corresponding to the different colors, this could be fixed cost, one color a different fixed costs
@param ar_x_grid array 1 by M, corresponding to the different colors, this could be fixed cost, one color a different fixed costs
@param mt_outcome matrix N by M matrix, each row is a different color, each column matches up to the x-axis vector. Each column could be a different amin and each row a different fixed cost.
Default
if (~isempty(varargin))

    % if invoked from outside overrid fully
    [ar_color_grid, ar_x_grid, mt_outcome, grh_sup_map] = varargin{:};

else
    clear all;
    close all;

    % internal invoke for testing
    ar_color_grid = linspace(1,10,6);
    ar_x_grid = linspace(-4,11,10);
    rng(123);
    mt_outcome = rand([length(ar_color_grid), length(ar_x_grid)]);

    grh_sup_map = containers.Map('KeyType','char', 'ValueType','any');

end
Default Map
crra = 1;
ar1_z = 0.90;
stderr_z = 0.40;
sunkc = 0.40;
amin = 0.10;
st_savefric_param = 'fixed costs';
st_pref_shock = ['crra = ' num2str(crra, '%3.2f') ', shock persistence = ' num2str(ar1_z, '%3.2f')  ', shock s.d. = ' num2str(stderr_z, '%3.2f')];
st_costs = ['other savings frictions: sunk-cost = ' num2str(sunkc, '%4.3f') ', amin = ' num2str(amin, '%4.3f')];
st_graph_title = {['Supply Curve of Credit With Varying ' st_savefric_param] ...
                  [st_pref_shock] ...
                  [st_costs]};

st_ytitle = 'Aggregate Supply of Savings';
st_xtitle = 'Savings Interest Rate';

grh_sup_map_default = containers.Map('KeyType','char', 'ValueType','any');
grh_sup_map_default('st_ytitle') = st_ytitle;
grh_sup_map_default('st_xtitle') = st_xtitle;
grh_sup_map_default('st_graph_title') = st_graph_title;
grh_sup_map_default('st_legend_loc') = 'southeast';
grh_sup_map_default('bl_graph_logy') = true;
Override
grh_sup_map = [grh_sup_map_default ; grh_sup_map];
Parse
params_group = values(grh_sup_map, {'st_ytitle', 'st_xtitle', 'st_graph_title'});
[st_ytitle, st_xtitle, st_graph_title] = params_group{:};

params_group = values(grh_sup_map, {'st_legend_loc', 'bl_graph_logy'});
[st_legend_loc, bl_graph_logy] = params_group{:};
Generaet Graph
if (bl_graph_logy)
    ar_it_plot = [1,2];
else
    ar_it_plot = [1];
end

for it_plot = ar_it_plot

    figure('PaperPosition', [0 0 7 4]);
    hold on;

    it_graph_counter = 0;
    cl_legend_mesh = [];
    cl_scatter_shapes = {'s','x','o','d','p','*'};
%             ar_fl_clr = jet(length(param_grid));
    ar_fl_clr = linspecer(length(ar_color_grid), 'sequential');
    for it_color = 1:length(ar_color_grid)

        fl_savefric_param = ar_color_grid(it_color);
        fl_fc = ar_color_grid(it_color);

        it_graph_counter = it_graph_counter + 1;
        ar_color = ar_fl_clr(it_color,:);

        % Access Y Values
        ar_y = mt_outcome(it_color,:);
        if (it_plot == 1)
            ar_y = ar_y;
        elseif (it_plot == 2)
            ar_y = log(ar_y+1);
        end

        % Access X Values
        it_csize = 100;
        if (it_color <= length(cl_scatter_shapes))
            st_shape = cl_scatter_shapes{it_color};
        else
            st_shape = 'x';
        end

        scatter(ar_x_grid', ar_y', it_csize, ar_color, st_shape, 'MarkerFaceAlpha', 1.0, 'MarkerEdgeAlpha', 1.0);

        line = plot(ar_x_grid, ar_y);
        line.HandleVisibility = 'off';
        line.Color = ar_color;
        line.LineStyle = '-';
        line.HandleVisibility = 'off';
        line.LineWidth = 2;

        cl_legend_mesh{it_graph_counter} = [st_savefric_param,':', num2str(fl_savefric_param)];

    end

    % Titling and Legends
    title(st_graph_title);
    if (it_plot == 1)
        ylabel([st_ytitle]);
    else
        ylabel(['LOG(' st_ytitle ' +1)']);
    end
    xlabel(st_xtitle);
    legend(cl_legend_mesh, 'Location', st_legend_loc);
    grid on;
    grid minor;

    snapnow;

end
end