Generate Statistics from Prob Mass Function over States
back to Fan's Dynamic Assets Repository Table of Content.
Contents
- FF_AZ_DS_POST_STATS post ff_az_ds statistics generation
- Default
- Parse
- f(y), f(c), f(a): Generate Key Distributional Statistics for Each outcome
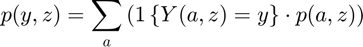
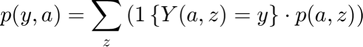
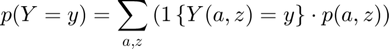
- f(y), f(c), f(a): Find p(outcome(states)), proability mass function for each outcome
- f(y), f(c), f(a): Compute Statistics for outcomes
- f(y), f(c), f(a): Store Statistics Specific to Each Outcome
- Covariance and Correlation
- f(y), f(c), f(a): Store Statistics Shared Table All Outcomes
function [result_map] = ff_az_ds_post_stats(varargin)
FF_AZ_DS_POST_STATS post ff_az_ds statistics generation
Having derived f(a,z) the probability mass function of the joint discrete random variables, we now obtain distributional statistics. Note that we know f(a,z), and we also know relevant policy functions a'(a,z), c(a,z), or other policy functions. We can simulate any choices that are a function of the random variables (a,z), using f(a,z)
parameter structure provides a list of
- from result_map('ar_st_pol_names'), get list of outcome matrix on state space
- simulate each outcome using f(a,z) for probability draws
- compute key statistics: (1) mean (expectation=sum) (2) sd (3) min and max (4) iqr (5) fraction = 0 (6) percentiles including: 99.9, 99, 95, every 5 in between 5, 1, 0.01.
Uses fake binomial data when file is invoke with defaults.
@param param_map container parameter container
@param support_map container support container
@param result_map container contains policy function matrix, value function matrix, iteration results
@param mt_dist_az matrix N by M where N are asset states and M are shock states, the f(a,z) probability mass function derived earlier in ff_az_ds or ff_az_ds_vec
@return result_map container with statistics added to result_map
- the first element of each of these cell array is y(a,z), the outcome/choice at the state space points
- the second element of the cell is another container, which contains statistics computed for f(y) based on y(a,z) and f(a,z), f(y) is the probability mass function for outcome y given the stationary distribution f(a,z). The second element container also includes f(y) itself as well as f(y,z).
- additionally, result_map also stores some of the statistics for different variables jointly together. (a) tb_outcomes_meansdperc: where each row is a different outcome of the model, and each table column stores a different statistics of interest. (b) tb_outcomes_fracheld: which measures the fraction of asset held by different people.
@example
  bl_input_override = true;
  result_map = ff_az_ds_post_stats(support_map, result_map, mt_dist_az, bl_input_override);
@include
Default
use binomial as test case, z maps to binomial win prob, remember binom approximates normal.
if (~isempty(varargin))
    % if invoked from outside overrid fully
    [support_map, result_map, mt_dist_az] = varargin{:};
    bl_display_final_dist_detail_local = false;
else
    clear all;
    close all;

    it_states = 6;
    it_shocks = 5;
    fl_binom_n = it_states-1;
    ar_binom_p = (1:(it_shocks))./(it_shocks+2);
    ar_binom_x = (0:1:(it_states-1)) -3;

    % f(z)
    ar_binom_p_prob = binopdf(0:(it_shocks-1), it_shocks-1, 0.5);
    % f(a,z), mass for a, z
    mt_dist_az = zeros([it_states, it_shocks]);
    for it_z=1:it_shocks
        % f(a|z)
        f_a_condi_z = binopdf(ar_binom_x - min(ar_binom_x), fl_binom_n, ar_binom_p(it_z));
        % f(z)
        f_z = ar_binom_p_prob(it_z);
        % f(a,z)=f(a|z)*f(z)
        mt_dist_az(:, it_z) = f_a_condi_z*f_z;
    end

    % y(a,z), some non-smooth structure
    rng(123);
    mt_pol_a = ar_binom_x' - 0.01*ar_binom_x'.^2  + ar_binom_p - 0.5*ar_binom_p.^2 + rand([it_states, it_shocks]);
    mt_pol_a = round(mt_pol_a*3);

    rng(456);
    mt_pol_c = 10 -(mt_pol_a) + 15*(rand([it_states, it_shocks])-0.5);

    % Generate result_map
    result_map = containers.Map('KeyType','char', 'ValueType','any');
    result_map('cl_mt_pol_a') = {mt_pol_a, zeros(1)};
    result_map('cl_mt_pol_c') = {mt_pol_c, zeros(1)};
    result_map('ar_st_pol_names') = ["cl_mt_pol_a", "cl_mt_pol_c"];

    % support_map
    support_map = containers.Map('KeyType','char', 'ValueType','any');
    support_map('bl_display_final_dist') = true;
    support_map('bl_display_final_dist_detail') = true;
    bl_display_final_dist_detail_local = true;
end
Parse
% support_map
params_group = values(support_map, {'bl_display_final_dist', 'bl_display_final_dist_detail'});
[bl_display_final_dist, bl_display_final_dist_detail] = params_group{:};
if (bl_display_final_dist_detail)
    bl_display_drvstats = true;
else
    bl_display_drvstats = false;
end

% result_map
params_group = values(result_map, {'ar_st_pol_names'});
[ar_st_pol_names] = params_group{:};
f(y), f(c), f(a): Generate Key Distributional Statistics for Each outcome
Loop over outcomes, see end of ff_az_vf_vecsv where these are created
for it_outcome_ctr=1:length(ar_st_pol_names)
f(y), f(c), f(a): Find p(outcome(states)), proability mass function for each outcome
Using from tools: fft_disc_rand_var_mass2outcomes, compute unique sorted outcomes for y(a,z) and find:
note: sum(mt_dist_az, 2) = result_map('cl_mt_pol_a'){2}, but not at small simulation grids. These two might be different because pol_a is based on a choices, mt_dist_az is based on a states
see end of ff_az_vf_vecsv outcomes in result_map are cells with two elements, first element is y(a,z), second element will be f(y) and y, generated here.
    st_cur_output_key = ar_st_pol_names(it_outcome_ctr);
    cl_mt_choice_cur = result_map(st_cur_output_key);
    mt_choice_cur = cl_mt_choice_cur{1};

    % run function from tools: fft_disc_rand_var_mass2outcomes
    % <https://fanwangecon.github.io/CodeDynaAsset/tools/html/fft_disc_rand_var_mass2outcomes.html>
    bl_input_override = true;
    [ar_choice_prob_byY, ar_choice_unique_sorted_byY, mt_choice_prob_byYZ, mt_choice_prob_byYA] = ...
        fft_disc_rand_var_mass2outcomes(st_cur_output_key, mt_choice_cur, mt_dist_az, bl_input_override);
f(y), f(c), f(a): Compute Statistics for outcomes
Using from tools: fft_disc_rand_var_stats, compute these outcomes:
- $\mu_Y = E(Y) = \sum_{y} p(Y=y) \cdot y $
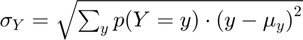

- percentiles:

- fraction of outcome held by up to percentiles:
    % run function fft_disc_rand_var_stats.m from tools:
    % <https://fanwangecon.github.io/CodeDynaAsset/tools/html/fft_disc_rand_var_stats.html>
    [ds_stats_map] = fft_disc_rand_var_stats(st_cur_output_key, ar_choice_unique_sorted_byY', ar_choice_prob_byY', bl_display_drvstats);

    % prcess results
    % retrieve scalar statistics:
    fl_choice_mean = ds_stats_map('fl_choice_mean');
    fl_choice_sd = ds_stats_map('fl_choice_sd');
    fl_choice_coefofvar = ds_stats_map('fl_choice_coefofvar');
    fl_choice_min = ds_stats_map('fl_choice_min');
    fl_choice_max = ds_stats_map('fl_choice_max');
    fl_choice_prob_zero = ds_stats_map('fl_choice_prob_zero');
    fl_choice_prob_below_zero = ds_stats_map('fl_choice_prob_below_zero');
    fl_choice_prob_above_zero = ds_stats_map('fl_choice_prob_above_zero');
    fl_choice_prob_min = ds_stats_map('fl_choice_prob_min');
    fl_choice_prob_max = ds_stats_map('fl_choice_prob_max');
    % retrieve distributional array stats
    ar_choice_percentiles = ds_stats_map('ar_choice_percentiles');
    ar_choice_perc_fracheld = ds_stats_map('ar_choice_perc_fracheld');
----------------------------------------
xxxxxxxxxxxxxxxxxxxxxxxxxxxxxxxxxxxxxxxx
Summary Statistics for: cl_mt_pol_a
xxxxxxxxxxxxxxxxxxxxxxxxxxxxxxxxxxxxxxxx
----------------------------------------
fl_choice_mean
   -0.1108

fl_choice_sd
    4.1239

fl_choice_coefofvar
  -37.2149

fl_choice_prob_zero
    0.0643

fl_choice_prob_below_zero
    0.5487

fl_choice_prob_above_zero
    0.3871

fl_choice_prob_max
    0.0273

tb_disc_cumu
    cl_mt_pol_aDiscreteVal    cl_mt_pol_aDiscreteValProbMass     CDF      cumsumFrac
    ______________________    ______________________________    ______    __________

              -7                         0.051764               5.1764      3.2699
              -6                         0.050217               10.198      5.9889
              -5                          0.10978               21.176      10.942
              -4                        0.0014875               21.324      10.996
              -3                          0.11706               33.031      14.165
              -2                        0.0080324               33.834       14.31
              -1                          0.21033               54.867      16.208
               0                         0.064259               61.293      16.208
               2                         0.049682               66.261      15.311
               3                         0.096388                 75.9      12.702

    cl_mt_pol_aDiscreteVal    cl_mt_pol_aDiscreteValProbMass     CDF      cumsumFrac
    ______________________    ______________________________    ______    __________

              -1                           0.21033              54.867      16.208
               0                          0.064259              61.293      16.208
               2                          0.049682              66.261      15.311
               3                          0.096388                75.9      12.702
               4                          0.085679              84.468      9.6092
               5                          0.065337              91.002      6.6611
               6                          0.057231              96.725      3.5623
               7                         0.0054218              97.267      3.2198
               8                        3.7187e-06              97.267      3.2196
               9                          0.027329                 100           1

tb_prob_drv
    percentiles    cl_mt_pol_aDiscreteValPercentileValues    fracOfSumHeldBelowThisPercentile
    ___________    ______________________________________    ________________________________

        0.1                          -7                                   3.2699
          1                          -7                                   3.2699
          5                          -7                                   3.2699
         10                          -6                                   5.9889
         15                          -5                                   10.942
         20                          -5                                   10.942
         25                          -3                                   14.165
         35                          -1                                   16.208
         50                          -1                                   16.208
         65                           2                                   15.311
         75                           3                                   12.702
         80                           4                                   9.6092
         85                           5                                   6.6611
         90                           5                                   6.6611
         95                           6                                   3.5623
         99                           9                                        1
       99.9                           9                                        1
----------------------------------------
xxxxxxxxxxxxxxxxxxxxxxxxxxxxxxxxxxxxxxxx
Summary Statistics for: cl_mt_pol_c
xxxxxxxxxxxxxxxxxxxxxxxxxxxxxxxxxxxxxxxx
----------------------------------------
fl_choice_mean
    8.8423

fl_choice_sd
    6.5845

fl_choice_coefofvar
    0.7447

fl_choice_prob_zero
     0

fl_choice_prob_below_zero
    0.0273

fl_choice_prob_above_zero
    0.9727

fl_choice_prob_max
    0.0465

tb_disc_cumu
    cl_mt_pol_cDiscreteVal    cl_mt_pol_cDiscreteValProbMass     CDF      cumsumFrac
    ______________________    ______________________________    ______    ___________

            -6.3772                       0.015232              1.5232      -0.010985
            -4.4805                       0.011621              2.6853      -0.016874
           -0.72091                     0.00047599              2.7329      -0.016913
            0.14102                       0.057119              8.4448      -0.016002
            0.27238                       0.085679              17.013      -0.013362
            0.50318                       0.023242              19.337       -0.01204
             2.7525                        0.02975              22.312     -0.0027791
             3.5617                     3.7187e-06              22.312     -0.0027776
             4.0352                      0.0059499              22.907    -6.2407e-05
             5.1855                      0.0054218              23.449      0.0031172

    cl_mt_pol_cDiscreteVal    cl_mt_pol_cDiscreteValProbMass     CDF      cumsumFrac
    ______________________    ______________________________    ______    __________

            13.231                       0.028917               65.473     0.36675
            13.357                       0.018593               67.332     0.39484
            13.799                        0.12852               80.184     0.59539
            13.901                       0.000119               80.196     0.59558
             15.71                       0.024097               82.605     0.63839
            16.255                      0.0080324               83.409     0.65316
            16.887                       0.092967               92.705      0.8307
            18.136                       0.022848                94.99     0.87756
             19.35                      0.0036146               95.352     0.88547
            21.786                       0.046484                  100           1

tb_prob_drv
    percentiles    cl_mt_pol_cDiscreteValPercentileValues    fracOfSumHeldBelowThisPercentile
    ___________    ______________________________________    ________________________________

        0.1                       -6.3772                                -0.010985
          1                       -6.3772                                -0.010985
          5                       0.14102                                -0.016002
         10                       0.27238                                -0.013362
         15                       0.27238                                -0.013362
         20                        2.7525                               -0.0027791
         25                        5.2138                                 0.041007
         35                        6.2166                                   0.1181
         50                        6.5321                                   0.1893
         65                        13.231                                  0.36675
         75                        13.799                                  0.59539
         80                        13.799                                  0.59539
         85                        16.887                                   0.8307
         90                        16.887                                   0.8307
         95                         19.35                                  0.88547
         99                        21.786                                        1
       99.9                        21.786                                        1
f(y), f(c), f(a): Store Statistics Specific to Each Outcome
see intro section
    % Append prob mass functions to ds_stats_map
    ds_stats_map('mt_choice_prob_byYZ') = mt_choice_prob_byYZ;
    ds_stats_map('mt_choice_prob_byYA') = mt_choice_prob_byYA;
    ds_stats_map('ar_choice_unique_sorted_byY') = ar_choice_unique_sorted_byY;
    ds_stats_map('ar_choice_prob_byY') = ar_choice_prob_byY;
    % ds_stats_map is second element of cell for the key for the variable
    % in result_map
    cl_mt_choice_cur{2} = ds_stats_map;
    result_map(st_cur_output_key) = cl_mt_choice_cur;

    % key stats
    ar_keystats = [fl_choice_mean fl_choice_sd fl_choice_coefofvar fl_choice_min fl_choice_max ...
        fl_choice_prob_zero fl_choice_prob_below_zero fl_choice_prob_above_zero ...
        fl_choice_prob_min fl_choice_prob_max ar_choice_percentiles];
    cl_outcome_names(it_outcome_ctr) = st_cur_output_key;
    if (it_outcome_ctr == 1)
        mt_outcomes_meansdperc = ar_keystats;
        mt_outcomes_fracheld = ar_choice_perc_fracheld;
    else
        mt_outcomes_meansdperc = [mt_outcomes_meansdperc; ar_keystats];
        mt_outcomes_fracheld = [mt_outcomes_fracheld; ar_choice_perc_fracheld];
    end
end

if (bl_display_final_dist || bl_display_final_dist_detail)

    tb_outcomes_meansdperc = array2table(mt_outcomes_meansdperc);
    ar_fl_percentiles = ds_stats_map('ar_fl_percentiles');
    cl_col_names = ['mean', 'sd', 'coefofvar', 'min', 'max', ...
                    'pYis0', 'pYls0', 'pYgr0', 'pYisMINY', 'pYisMAXY', ...
                    strcat('p', string(ar_fl_percentiles))];
    tb_outcomes_meansdperc.Properties.VariableNames = matlab.lang.makeValidName(cl_col_names);
    tb_outcomes_meansdperc.Properties.RowNames = matlab.lang.makeValidName(cl_outcome_names);

    if (bl_display_final_dist_detail_local)
        disp('xxx tb_outcomes_meansdperc: mean, sd, percentiles xxx')
        disp(rows2vars(tb_outcomes_meansdperc));
    end

    % Process Aset Held by up to percentiles
    tb_outcomes_fracheld = array2table(mt_outcomes_fracheld);
    cl_col_names = [strcat('fracByP', string(ar_fl_percentiles))];
    tb_outcomes_fracheld.Properties.VariableNames = matlab.lang.makeValidName(cl_col_names);
    tb_outcomes_fracheld.Properties.RowNames = matlab.lang.makeValidName(cl_outcome_names);

    if (bl_display_final_dist_detail_local)
        disp('xxx tb_outcomes_fracheld: fraction of asset/income/etc held by hh up to this percentile xxx')
        disp(rows2vars(tb_outcomes_fracheld));
    end

end
xxx tb_outcomes_meansdperc: mean, sd, percentiles xxx
    OriginalVariableNames    cl_mt_pol_a    cl_mt_pol_c
    _____________________    ___________    ___________

         'mean'               -0.11081         8.8423
         'sd'                   4.1239         6.5845
         'coefofvar'           -37.215        0.74466
         'min'                      -7        -6.3772
         'max'                       9         21.786
         'pYis0'              0.064259              0
         'pYls0'               0.54867       0.027329
         'pYgr0'               0.38707        0.97267
         'pYisMINY'           0.051764       0.015232
         'pYisMAXY'           0.027329       0.046484
         'p0_1'                     -7        -6.3772
         'p1'                       -7        -6.3772
         'p5'                       -7        0.14102
         'p10'                      -6        0.27238
         'p15'                      -5        0.27238
         'p20'                      -5         2.7525
         'p25'                      -3         5.2138
         'p35'                      -1         6.2166
         'p50'                      -1         6.5321
         'p65'                       2         13.231
         'p75'                       3         13.799
         'p80'                       4         13.799
         'p85'                       5         16.887
         'p90'                       5         16.887
         'p95'                       6          19.35
         'p99'                       9         21.786
         'p99_9'                     9         21.786

xxx tb_outcomes_fracheld: fraction of asset/income/etc held by hh up to this percentile xxx
    OriginalVariableNames    cl_mt_pol_a    cl_mt_pol_c
    _____________________    ___________    ___________

        'fracByP0_1'           3.2699        -0.010985
        'fracByP1'             3.2699        -0.010985
        'fracByP5'             3.2699        -0.016002
        'fracByP10'            5.9889        -0.013362
        'fracByP15'            10.942        -0.013362
        'fracByP20'            10.942       -0.0027791
        'fracByP25'            14.165         0.041007
        'fracByP35'            16.208           0.1181
        'fracByP50'            16.208           0.1893
        'fracByP65'            15.311          0.36675
        'fracByP75'            12.702          0.59539
        'fracByP80'            9.6092          0.59539
        'fracByP85'            6.6611           0.8307
        'fracByP90'            6.6611           0.8307
        'fracByP95'            3.5623          0.88547
        'fracByP99'                 1                1
        'fracByP99_9'               1                1
Covariance and Correlation
Having computed elsewhere E(X), E(Y), and SD(X), SD(Y), and given X(a,z) and Y(a,z), which are the optimal choices along the endogenous state space grid a, and the exogenous state space grid z, and given also f(a,z), the probability mass function over (a,z), we compute covariance and correlation between outcomes X and Y.
- Covariance

- Correlation
for it_outcome_x_ctr=1:length(ar_st_pol_names)

    st_cur_output_x_key = ar_st_pol_names(it_outcome_x_ctr);

    cl_mt_choice_cur = result_map(st_cur_output_x_key);
    ds_stats_map = cl_mt_choice_cur{2};

    cl_mt_choice_cur = result_map(st_cur_output_x_key);
    mt_choice_x_bystates = cl_mt_choice_cur{1};
    fl_choice_x_mean = ds_stats_map('fl_choice_mean');
    fl_choice_x_sd = ds_stats_map('fl_choice_sd');

    ar_covvar = zeros([1,length(ar_st_pol_names)*2]);
    ar_st_covvar = strings([1,length(ar_st_pol_names)*2]);
    for it_outcome_y_ctr=1:length(ar_st_pol_names)

        st_cur_output_y_key = ar_st_pol_names(it_outcome_y_ctr);

        cl_mt_choice_cur = result_map(st_cur_output_y_key);
        ds_stats_map = cl_mt_choice_cur{2};

        cl_mt_choice_cur = result_map(st_cur_output_y_key);
        mt_choice_y_bystates = cl_mt_choice_cur{1};
        fl_choice_y_mean = ds_stats_map('fl_choice_mean');
        fl_choice_y_sd = ds_stats_map('fl_choice_sd');

        covvar_input_map = containers.Map('KeyType','char', 'ValueType','any');
        covvar_input_map('mt_choice_x_bystates') = mt_choice_x_bystates;
        covvar_input_map('mt_choice_y_bystates') = mt_choice_y_bystates;
        covvar_input_map('mt_dist_bystates') = mt_dist_az;
        covvar_input_map('fl_choice_x_mean') = fl_choice_x_mean;
        covvar_input_map('fl_choice_x_sd') = fl_choice_x_sd;
        covvar_input_map('fl_choice_y_mean') = fl_choice_y_mean;
        covvar_input_map('fl_choice_y_sd') = fl_choice_y_sd;

        [fl_cov_xy, fl_cor_xy] = fft_disc_rand_var_mass2covcor(covvar_input_map);

        % only include the y name, x name is from the row
        st_x_y_cov = strjoin(["fl_cov_" st_cur_output_y_key], '');
        st_x_y_cor = strjoin(["fl_cor_" st_cur_output_y_key], '');
        ds_stats_map(st_x_y_cov) = fl_cov_xy;
        ds_stats_map(st_x_y_cor) = fl_cor_xy;

        ar_covvar(it_outcome_y_ctr*2-1) = fl_cov_xy;
        ar_covvar(it_outcome_y_ctr*2) = fl_cor_xy;
        ar_st_covvar(it_outcome_y_ctr*2-1) = string(st_x_y_cov);
        ar_st_covvar(it_outcome_y_ctr*2) = string(st_x_y_cor);

        cl_mt_choice_cur{2} = ds_stats_map;
        result_map(st_cur_output_y_key) = cl_mt_choice_cur;
    end

    if (it_outcome_x_ctr == 1)
        mt_outcomes_covvar = ar_covvar;
    else
        mt_outcomes_covvar = [mt_outcomes_covvar; ar_covvar];
    end

end

if (bl_display_final_dist || bl_display_final_dist_detail)

    tb_outcomes_covvar = array2table(mt_outcomes_covvar);
    tb_outcomes_covvar.Properties.VariableNames = matlab.lang.makeValidName(ar_st_covvar);
    tb_outcomes_covvar.Properties.RowNames = matlab.lang.makeValidName(cl_outcome_names);

    if (bl_display_final_dist_detail_local)
        disp('xxx tb_outcomes_covvar: variance correlation xxx')
        disp(rows2vars(tb_outcomes_covvar));
    end

end
xxx tb_outcomes_covvar: variance correlation xxx
    OriginalVariableNames    cl_mt_pol_a    cl_mt_pol_c
    _____________________    ___________    ___________

    'fl_cov_cl_mt_pol_a'        17.007        -22.084
    'fl_cor_cl_mt_pol_a'             1       -0.81327
    'fl_cov_cl_mt_pol_c'       -22.084         43.356
    'fl_cor_cl_mt_pol_c'      -0.81327              1
f(y), f(c), f(a): Store Statistics Shared Table All Outcomes
% Add to result_map
mt_outcomes = [mt_outcomes_meansdperc, mt_outcomes_covvar, mt_outcomes_fracheld];
result_map('mt_outcomes') = mt_outcomes;

if (bl_display_final_dist || bl_display_final_dist_detail)

    tb_outcomes = [tb_outcomes_meansdperc, tb_outcomes_covvar, tb_outcomes_fracheld];
    result_map('tb_outcomes') = tb_outcomes;

    if (bl_display_final_dist_detail)
        disp(rows2vars(tb_outcomes));
    else
        disp(tb_outcomes);
    end

end
    OriginalVariableNames    cl_mt_pol_a    cl_mt_pol_c
    _____________________    ___________    ___________

    'mean'                    -0.11081          8.8423
    'sd'                        4.1239          6.5845
    'coefofvar'                -37.215         0.74466
    'min'                           -7         -6.3772
    'max'                            9          21.786
    'pYis0'                   0.064259               0
    'pYls0'                    0.54867        0.027329
    'pYgr0'                    0.38707         0.97267
    'pYisMINY'                0.051764        0.015232
    'pYisMAXY'                0.027329        0.046484
    'p0_1'                          -7         -6.3772
    'p1'                            -7         -6.3772
    'p5'                            -7         0.14102
    'p10'                           -6         0.27238
    'p15'                           -5         0.27238
    'p20'                           -5          2.7525
    'p25'                           -3          5.2138
    'p35'                           -1          6.2166
    'p50'                           -1          6.5321
    'p65'                            2          13.231
    'p75'                            3          13.799
    'p80'                            4          13.799
    'p85'                            5          16.887
    'p90'                            5          16.887
    'p95'                            6           19.35
    'p99'                            9          21.786
    'p99_9'                          9          21.786
    'fl_cov_cl_mt_pol_a'        17.007         -22.084
    'fl_cor_cl_mt_pol_a'             1        -0.81327
    'fl_cov_cl_mt_pol_c'       -22.084          43.356
    'fl_cor_cl_mt_pol_c'      -0.81327               1
    'fracByP0_1'                3.2699       -0.010985
    'fracByP1'                  3.2699       -0.010985
    'fracByP5'                  3.2699       -0.016002
    'fracByP10'                 5.9889       -0.013362
    'fracByP15'                 10.942       -0.013362
    'fracByP20'                 10.942      -0.0027791
    'fracByP25'                 14.165        0.041007
    'fracByP35'                 16.208          0.1181
    'fracByP50'                 16.208          0.1893
    'fracByP65'                 15.311         0.36675
    'fracByP75'                 12.702         0.59539
    'fracByP80'                 9.6092         0.59539
    'fracByP85'                 6.6611          0.8307
    'fracByP90'                 6.6611          0.8307
    'fracByP95'                 3.5623         0.88547
    'fracByP99'                      1               1
    'fracByP99_9'                    1               1
end
ans =

  Map with properties:

        Count: 5
      KeyType: char
    ValueType: any