Compute Distributional Statistics from a Discrete Random Variable
back to Fan's Dynamic Assets Repository Table of Content.
Contents
function [ds_stats_map] = fft_disc_rand_var_stats(varargin)
FFT_DISCT_RAND_VAR_STATS compute mean, sd, percentiles
Model simulation generates discrete random variables, to analyze, need to calculate various statistics
Statistics include:


- percentiles:

- fraction of outcome held by up to percentiles:
@param st_var_name string name of the variable (choice/outcome) been analyzed
@param ar_choice_unique_sorted array 1 by N elements in the sample space of the discrete random variable ordered. Unique consumption values ordered. Unique asset choices ordered. etc.
@param ar_choice_prob array 1 by N probability mass function associated with each element ar_choice_unique_sorted
@param ar_fl_percentiles array 1 by M some vector of percentiles (0 to 100) that we would like to compute based on the discrete random variable's probability mass function and x values.
@return ds_stats_map container various distributional statistics
@example
% run function
st_var_name = 'binom';
[ds_stats_map] = fft_disc_rand_var_stats(st_var_name, ar_choice_unique_sorted, ar_choice_prob, ar_fl_percentiles);
% retrieve scalar statistics
% fl_choice_mean = ds_stats_map('fl_choice_mean');
fl_choice_sd = ds_stats_map('fl_choice_sd');
fl_choice_prob_zero = ds_stats_map('fl_choice_prob_zero');
fl_choice_prob_max = ds_stats_map('fl_choice_prob_max');
% retrieve distributional array stats
ar_choice_percentiles = ds_stats_map('ar_choice_percentiles');
ar_choice_perc_fracheld = ds_stats_map('ar_choice_perc_fracheld');
Default
use binomial as test case
fl_binom_n = 30;
fl_binom_p = 0.3;
ar_binom_x = 0:1:fl_binom_n;

% f(x)
ar_choice_prob = binopdf(ar_binom_x, fl_binom_n, fl_binom_p);
% x
ar_choice_unique_sorted = ar_binom_x - 10;
% percentiles of interest
ar_fl_percentiles = [0.1 1 5:5:25 35:15:65 75:5:95 99 99.9];

% display
st_var_name = 'binom';

% display
bl_display_drvstats = true;

% default
default_params = {st_var_name ar_choice_unique_sorted ar_choice_prob bl_display_drvstats ar_fl_percentiles};
Parse Parameters
[default_params{1:length(varargin)}] = varargin{:};
[st_var_name, ar_choice_unique_sorted, ar_choice_prob, bl_display_drvstats, ar_fl_percentiles] = default_params{:};
f(y), f(c), f(a): Compute Scalar Statistics for outcomes
Compute these outcomes:
- mean:
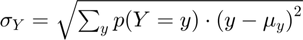
- sd:
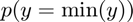
- prob(outcome=0):
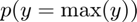
- prob(outcome=max(outcome)):
% Mean of discrete random variable
fl_choice_mean = ar_choice_prob*ar_choice_unique_sorted';
% SD of discrete random variable
fl_choice_sd = sqrt(ar_choice_prob*((ar_choice_unique_sorted'-fl_choice_mean).^2));
% Coef of Variation of discrete random variable
fl_choice_coefofvar = fl_choice_sd/fl_choice_mean;
% min of y from policy function, p(y) might be 0
fl_choice_min = min(ar_choice_unique_sorted);
% max of y from policy function, p(y) might be 0
fl_choice_max = max(ar_choice_unique_sorted);
% prob(outcome=min(outcome)), fraction of people not saving for example
fl_choice_prob_min = sum(ar_choice_prob(ar_choice_unique_sorted == min(ar_choice_unique_sorted)));
% prob(outcome=0), fraction of people not saving for example
fl_choice_prob_zero = sum(ar_choice_prob(ar_choice_unique_sorted == 0));
% prob(outcome<0), fraction of people borrowing
fl_choice_prob_below_zero = sum(ar_choice_prob(ar_choice_unique_sorted < 0));
% prob(outcome>0), fraction of people borrowing
fl_choice_prob_above_zero = sum(ar_choice_prob(ar_choice_unique_sorted > 0));
% prob(outcome=max(outcome)), fraction of people saving up to max of grid,
% in principle if this is large, need to increase grid max value
fl_choice_prob_max = sum(ar_choice_prob(ar_choice_unique_sorted == max(ar_choice_unique_sorted)));
f(y), f(c), f(a): Compute Distributional Statistics for outcomes
Compute these outcomes:
- percentiles:
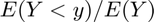
- share of outcome (consumption/assets) held by households below this percentile: . Note that this statistics could exceed 1. Suppose the average level is negative, but there are both positive and negative
 , then the statistics will first be what fraction of overall debt is held by up to this percentile, then it will exceed 100 percent, as we move towards the final
  values, then as it goes through the
  values, we will move back to 100 percent.
% cumulative share of total outcome held by up to this level for outcomes
% like fraction of asset held by lowest highest fractions: E(X<x)
ar_choice_unique_cumufrac = cumsum(ar_choice_prob.*ar_choice_unique_sorted)/fl_choice_mean;

% Key Percentile Statistics
ar_choice_prob_cumsum = cumsum(ar_choice_prob)*100;

% ar_choice_percentiles: percentiles for the outcome variable
ar_choice_percentiles = zeros(size(ar_fl_percentiles));

% fraction of aggregate outcome variable held up to this percentile
ar_choice_perc_fracheld = zeros(size(ar_fl_percentiles));

for it_percentile = 1:length(ar_fl_percentiles)
    % get percentile of interest
    fl_cur_percentile = ar_fl_percentiles(it_percentile);
    % in the cumu prob array, first element higher or equal to current
    % percentile
    it_first_higher_idx = (cumsum(ar_choice_prob_cumsum >= fl_cur_percentile) == 1);
    % assign percentile
    fl_percentile = ar_choice_unique_sorted(it_first_higher_idx);
    fl_cumfrac = ar_choice_unique_cumufrac(it_first_higher_idx);
    if (length(fl_percentile) > 1)
        fl_percentile = fl_percentile(1);
        fl_cumfrac = fl_cumfrac(1);
    end
    ar_choice_percentiles(it_percentile) = fl_percentile;
    % asset held by up to this percentile
    ar_choice_perc_fracheld(it_percentile) = fl_cumfrac;
end
Collect Statistics
ds_stats_map = containers.Map('KeyType','char', 'ValueType','any');

% scalar statistics
ds_stats_map('fl_choice_mean') = fl_choice_mean;
ds_stats_map('fl_choice_sd') = fl_choice_sd;
ds_stats_map('fl_choice_coefofvar') = fl_choice_coefofvar;
ds_stats_map('fl_choice_min') = fl_choice_min;
ds_stats_map('fl_choice_max') = fl_choice_max;
ds_stats_map('fl_choice_prob_zero') = fl_choice_prob_zero;
ds_stats_map('fl_choice_prob_below_zero') = fl_choice_prob_below_zero;
ds_stats_map('fl_choice_prob_above_zero') = fl_choice_prob_above_zero;
ds_stats_map('fl_choice_prob_min') = fl_choice_prob_min;
ds_stats_map('fl_choice_prob_max') = fl_choice_prob_max;

% distributional array stats
ds_stats_map('ar_fl_percentiles') = ar_fl_percentiles;
ds_stats_map('ar_choice_percentiles') = ar_choice_percentiles;
ds_stats_map('ar_choice_perc_fracheld') = ar_choice_perc_fracheld;
Display
if (bl_display_drvstats)

    disp('----------------------------------------');
    disp('xxxxxxxxxxxxxxxxxxxxxxxxxxxxxxxxxxxxxxxx');
    disp(['Summary Statistics for: ' char(st_var_name)])
    disp('xxxxxxxxxxxxxxxxxxxxxxxxxxxxxxxxxxxxxxxx');
    disp('----------------------------------------');

    disp('fl_choice_mean');
    disp(fl_choice_mean);
    disp('fl_choice_sd');
    disp(fl_choice_sd);
    disp('fl_choice_coefofvar');
    disp(fl_choice_coefofvar);

    disp('fl_choice_prob_zero');
    disp(fl_choice_prob_zero);
    disp('fl_choice_prob_below_zero');
    disp(fl_choice_prob_below_zero);
    disp('fl_choice_prob_above_zero');
    disp(fl_choice_prob_above_zero);
    disp('fl_choice_prob_max');
    disp(fl_choice_prob_max);


    disp('tb_disc_cumu');
    tb_disc_cumu = table(ar_choice_unique_sorted', ar_choice_prob', ...
                         ar_choice_prob_cumsum', ar_choice_unique_cumufrac');
    st_var_name = [char(st_var_name) ' discrete val'];
    st_var_name_p = [char(st_var_name) ' prob mass'];
    tb_disc_cumu.Properties.VariableNames = ...
        matlab.lang.makeValidName([st_var_name, st_var_name_p, "CDF", "cumsum frac"]);
    disp(head(tb_disc_cumu,10));
    disp(tail(tb_disc_cumu,10));

    disp('tb_prob_drv');
    tb_prob_drv = table(ar_fl_percentiles', ar_choice_percentiles', ar_choice_perc_fracheld');
    st_var_name = [char(st_var_name) ' percentile values'];
    tb_prob_drv.Properties.VariableNames = matlab.lang.makeValidName(["percentiles", st_var_name, "frac of sum held below this percentile"]);
    disp(tb_prob_drv);

%     fft_container_map_display(ds_stats_map)
end
----------------------------------------
xxxxxxxxxxxxxxxxxxxxxxxxxxxxxxxxxxxxxxxx
Summary Statistics for: binom
xxxxxxxxxxxxxxxxxxxxxxxxxxxxxxxxxxxxxxxx
----------------------------------------
fl_choice_mean
   -1.0000

fl_choice_sd
    2.5100

fl_choice_coefofvar
   -2.5100

fl_choice_prob_zero
    0.1416

fl_choice_prob_below_zero
    0.5888

fl_choice_prob_above_zero
    0.2696

fl_choice_prob_max
   2.0589e-16

tb_disc_cumu
    binomDiscreteVal    binomDiscreteValProbMass       CDF       cumsumFrac
    ________________    ________________________    _________    __________

          -10                  2.2539e-05           0.0022539    0.00022539
           -9                  0.00028979            0.031233     0.0028335
           -8                   0.0018008             0.21132       0.01724
           -7                   0.0072034             0.93166      0.067664
           -6                    0.020838              3.0155       0.19269
           -5                     0.04644              7.6595       0.42489
           -4                    0.082928              15.952       0.75661
           -3                     0.12185              28.138        1.1222
           -2                     0.15014              43.152        1.4224
           -1                     0.15729              58.881        1.5797

    binomDiscreteVal    binomDiscreteValProbMass    CDF    cumsumFrac
    ________________    ________________________    ___    __________

           11                  6.0392e-06           100        1
           12                  1.0588e-06           100        1
           13                  1.5784e-07           100        1
           14                   1.973e-08           100        1
           15                  2.0293e-09           100        1
           16                  1.6725e-10           100        1
           17                  1.0619e-11           100        1
           18                  4.8762e-13           100        1
           19                  1.4412e-14           100        1
           20                  2.0589e-16           100        1

tb_prob_drv
    percentiles    binomDiscreteValPercentileValues    fracOfSumHeldBelowThisPercentile
    ___________    ________________________________    ________________________________

        0.1                       -8                               0.01724
          1                       -6                               0.19269
          5                       -5                               0.42489
         10                       -4                               0.75661
         15                       -4                               0.75661
         20                       -3                                1.1222
         25                       -3                                1.1222
         35                       -2                                1.4224
         50                       -1                                1.5797
         65                        0                                1.5797
         75                        1                                1.4694
         80                        1                                1.4694
         85                        2                                1.3197
         90                        2                                1.3197
         95                        3                                1.1865
         99                        5                                1.0412
       99.9                        7                                1.0052
end
ans =

  Map with properties:

        Count: 13
      KeyType: char
    ValueType: any