flowchart TD
  subgraph inputs [Packaged data inputs]
    loans[tstm_loans]
    assetloan[tstm_asset_loan]
  end
  subgraph prep [Data prep]
    loans --> sel[select columns and drop NA loan length]
    sel --> cat[derive lender categories formal institutional forinfm3]
    assetloan --> startend[derive household start month and span]
  end
  subgraph skeleton [Household-month skeleton]
    cat --> skel[build household-month skeleton]
    startend --> skel
  end
  subgraph counts [Overlap counting]
    skel --> ov[count conditional formal-informal overlaps]
    ov --> tabs[overlap count tables]
    ov --> fig[optional overlap figure]
  end
This vignette implements PrjThaiHFID-#36: it counts how often households hold formal and informal loans at the same time, using the packaged loan-level file tstm_loans. It builds a household-month skeleton, then tabulates conditional overlaps between lender categories.
Unit of observation: household-month (built from the loan-level tstm_loans); overlap counts are reported across households and lender-category combinations.
Outputs at a glance
This vignette produces overlap count tables — it does not save a packaged dataset. Overlap figures are written under res/res_loan_overlap/ when the corresponding ls_save_res flag is set to TRUE (all default FALSE).
-
Inputs: packaged
tstm_loans(loan-level) andtstm_asset_loan(household-month), both with anonymized household and geography IDs; seeR/data.R. The household survey start month and contiguous span are derived in-memory fromtstm_asset_loan(no packagedtstm_hh_start_endfile). -
Tables: a household-month skeleton and conditional formal/informal overlap counts across lender categories (
formal,institutional,formalqf,forinfm3).
Pipeline structure
library(PrjThaiHFID)
library(dplyr)
#>
#> Attaching package: 'dplyr'
#> The following objects are masked from 'package:stats':
#>
#>     filter, lag
#> The following objects are masked from 'package:base':
#>
#>     intersect, setdiff, setequal, union
library(tidyr)
library(readr)
library(ggplot2)
library(kableExtra)
#>
#> Attaching package: 'kableExtra'
#> The following object is masked from 'package:dplyr':
#>
#>     group_rows

# storage path
# here::here() resolves to vignettes/ under Quarto (temporary _quarto.yml);
# find the package root explicitly so paths resolve under Quarto and knitr.
spn_pkg_root <- rprojroot::find_root(rprojroot::has_file("DESCRIPTION"))
spt_res <- file.path(spn_pkg_root, "res", "res_loan_overlap")
ls_save_res <- list(
  pl_density_pforcinf = FALSE,
  pl_density_pforcinf_pinfcfor = FALSE,
  pl_hist_phasloan = FALSE,
  pl_for_inf_jnt_1a_qf = FALSE,
  pl_for_inf_jnt_1b_qf = FALSE,
  pl_for_inf_jnt_2_qf = FALSE
)
cbp1 <- c(
  "#999999", "#E69F00", "#56B4E9", "#009E73",
  "#F0E442", "#0072B2", "#D55E00", "#CC79A7"
)
Categories and tabulations
# code to prepare `tstm_loans` dataset goes here
# 1000. Generate Loan IDs and MISC ----
# tstm_loans <- PrjThaiHFID::tstm_loans
# Unique ID for each loan
tstm_loans <- tstm_loans %>%
  select(
    S_region, provid_Num, vilid_Num, hhid_Num, surveymonth,
    formal, institutional, G_LenderType,
    everything()
  ) %>%
  drop_na(G_Loan_Repaid_Length) %>%
  arrange(hhid_Num, surveymonth, G_Loan_Repaid_Length) %>%
  mutate(loan_id = row_number())

# Tally loan types and drop NA
tstm_loans %>%
  group_by(G_LenderType) %>%
  tally()
#> # A tibble: 10 × 2
#>    G_LenderType                          n
#>    <chr>                             <int>
#>  1 Agri Coop                           577
#>  2 BAAC                               3396
#>  3 Commercial Bank                      64
#>  4 MoneyLender                         625
#>  5 Neighbor                            998
#>  6 Other Non-Indi Formal or Informal  4659
#>  7 Others                             1349
#>  8 PCG                                 501
#>  9 Relatives                          1363
#> 10 Village Fund                       7408
tstm_loans %>%
  group_by(G_LenderType, G_Location) %>%
  tally() %>%
  spread(G_Location, n)
#> # A tibble: 10 × 5
#> # Groups:   G_LenderType [10]
#>    G_LenderType             `Changwat and Out` `Tambon or Amphoe` Village `<NA>`
#>    <chr>                                 <int>              <int>   <int>  <int>
#>  1 Agri Coop                                29                547       1     NA
#>  2 BAAC                                    757               2636       2      1
#>  3 Commercial Bank                          17                 46       1     NA
#>  4 MoneyLender                             162                201     260      2
#>  5 Neighbor                                  3                 20     975     NA
#>  6 Other Non-Indi Formal o…                773               1146    2732      8
#>  7 Others                                  555                506     272     16
#>  8 PCG                                       3                  9     489     NA
#>  9 Relatives                               220                433     705      5
#> 10 Village Fund                              9                251    7148     NA
# Drop NA
tstm_loans <- tstm_loans %>%
  drop_na(G_LenderType)
Review formal, informal, and joint loan categories.
tstm_loans %>%
  group_by(G_LenderType, formal) %>%
  tally() %>%
  spread(formal, n)
#> # A tibble: 10 × 3
#> # Groups:   G_LenderType [10]
#>    G_LenderType                      `FALSE` `TRUE`
#>    <chr>                               <int>  <int>
#>  1 Agri Coop                             577     NA
#>  2 BAAC                                   NA   3396
#>  3 Commercial Bank                        NA     64
#>  4 MoneyLender                           625     NA
#>  5 Neighbor                              998     NA
#>  6 Other Non-Indi Formal or Informal    2732   1927
#>  7 Others                               1349     NA
#>  8 PCG                                   501     NA
#>  9 Relatives                            1363     NA
#> 10 Village Fund                           NA   7408
tstm_loans %>%
  group_by(institutional, G_LenderType, formal) %>%
  tally() %>%
  spread(formal, n)
#> # A tibble: 10 × 4
#> # Groups:   institutional, G_LenderType [10]
#>    institutional G_LenderType                      `FALSE` `TRUE`
#>    <lgl>         <chr>                               <int>  <int>
#>  1 FALSE         MoneyLender                           625     NA
#>  2 FALSE         Neighbor                              998     NA
#>  3 FALSE         Others                               1349     NA
#>  4 FALSE         Relatives                            1363     NA
#>  5 TRUE          Agri Coop                             577     NA
#>  6 TRUE          BAAC                                   NA   3396
#>  7 TRUE          Commercial Bank                        NA     64
#>  8 TRUE          Other Non-Indi Formal or Informal    2732   1927
#>  9 TRUE          PCG                                   501     NA
#> 10 TRUE          Village Fund                           NA   7408
tstm_loans %>%
  group_by(institutional, G_LenderType, formalqf) %>%
  tally() %>%
  spread(formalqf, n)
#> # A tibble: 10 × 4
#> # Groups:   institutional, G_LenderType [10]
#>    institutional G_LenderType                      `FALSE` `TRUE`
#>    <lgl>         <chr>                               <int>  <int>
#>  1 FALSE         MoneyLender                           625     NA
#>  2 FALSE         Neighbor                              998     NA
#>  3 FALSE         Others                               1349     NA
#>  4 FALSE         Relatives                            1363     NA
#>  5 TRUE          Agri Coop                              NA    577
#>  6 TRUE          BAAC                                   NA   3396
#>  7 TRUE          Commercial Bank                        NA     64
#>  8 TRUE          Other Non-Indi Formal or Informal    2732   1927
#>  9 TRUE          PCG                                    NA    501
#> 10 TRUE          Village Fund                           NA   7408
tstm_loans %>%
  group_by(institutional, G_LenderType, forinfm3) %>%
  tally() %>%
  spread(forinfm3, n)
#> # A tibble: 10 × 5
#> # Groups:   institutional, G_LenderType [10]
#>    institutional G_LenderType                     Formal Informal `Quasi-formal`
#>    <lgl>         <chr>                             <int>    <int>          <int>
#>  1 FALSE         MoneyLender                          NA      625             NA
#>  2 FALSE         Neighbor                             NA      998             NA
#>  3 FALSE         Others                               NA     1349             NA
#>  4 FALSE         Relatives                            NA     1363             NA
#>  5 TRUE          Agri Coop                            NA       NA            577
#>  6 TRUE          BAAC                               3396       NA             NA
#>  7 TRUE          Commercial Bank                      64       NA             NA
#>  8 TRUE          Other Non-Indi Formal or Inform…     NA       NA           4659
#>  9 TRUE          PCG                                  NA       NA            501
#> 10 TRUE          Village Fund                       7408       NA             NA
Stats to count conditional overlaps
Household Skeleton
First, rebuild the household start/span table from the anonymized tstm_asset_loan. For each household, surveymonth_start_hh is the first survey month observed and surveymonth_span_hh is the contiguous month span (last - first + 1). This replaces the former packaged data/tstm_hh_start_end.rda (which carried true, non-anonymized IDs); it is built in-memory and not saved to data/.
# 1140. Household start/span (in-memory; replaces data/tstm_hh_start_end.rda) ----
data(tstm_asset_loan)
tstm_hh_start_end <- tstm_asset_loan %>%
  group_by(id) %>%
  summarize(
    surveymonth_start_hh = min(month),
    surveymonth_end_hh = max(month),
    .groups = "drop"
  ) %>%
  mutate(surveymonth_span_hh = surveymonth_end_hh - surveymonth_start_hh + 1) %>%
  rename(hhid_Num = id) %>%
  select(hhid_Num, surveymonth_start_hh, surveymonth_span_hh)
Generate household skeleton.
Formal and Informal Base Definition Main
# View(tstm_hh_skeleton)
# 1200. loan span skeleton ----
# 1. long frame, observation is household loan month,
# for each month of each loan for each household

# select loans of one type and generate household loan id
for (bl_formal in c(TRUE, FALSE)) {
  tstm_loans_type <- tstm_loans %>%
    filter(formal == bl_formal) %>%
    arrange(hhid_Num, loan_id) %>%
    group_by(hhid_Num) %>%
    mutate(hh_loan_id = row_number()) %>%
    ungroup()

  tstm_loans_mths <- tstm_loans_type %>%
    select(loan_id, hhid_Num, hh_loan_id, surveymonth, G_Loan_Repaid_Length) %>%
    rename(
      mth_start = surveymonth,
      mth_duration = G_Loan_Repaid_Length
    ) %>%
    uncount(mth_duration) %>%
    group_by(loan_id) %>%
    mutate(surveymonth = row_number() + mth_start - 1) %>%
    ungroup()
  # View(tstm_loans_mths)

  # 1300. Loan long to wide
  # 3. reshape wide, each col is a different loan id, row is a household month, for each household, the number of months/rows is the coverage of loans over the span of the household
  tstm_loans_mth_wide <- tstm_loans_mths %>%
    select(hhid_Num, hh_loan_id, surveymonth) %>%
    arrange(hhid_Num, hh_loan_id, surveymonth) %>%
    mutate(has_loan = 1) %>%
    pivot_wider(
      id_cols = c("hhid_Num", "surveymonth"),
      names_from = "hh_loan_id",
      names_prefix = "loan_",
      values_from = has_loan
    )
  # View(tstm_loans_mth_wide)


  # 4. drop all columns, but keep months and household, these are the months in which this household has these loans
  tstm_loans_mth_cover_type <- tstm_loans_mth_wide %>%
    select(hhid_Num, surveymonth)

  if (bl_formal) {
    tstm_loans_mth_cover_formal <- tstm_loans_mth_cover_type %>%
      mutate(formal = TRUE)
  } else {
    tstm_loans_mth_cover_informal <- tstm_loans_mth_cover_type %>%
      mutate(informal = TRUE)
  }
}

# Merge formal and informal
tstm_loans_mth_cover_all <- tstm_hh_skeleton %>%
  left_join(tstm_loans_mth_cover_formal,
    by = (c("hhid_Num" = "hhid_Num", "surveymonth" = "surveymonth"))
  ) %>%
  left_join(tstm_loans_mth_cover_informal,
    by = (c("hhid_Num" = "hhid_Num", "surveymonth" = "surveymonth"))
  ) %>%
  arrange(hhid_Num, surveymonth)
# Print
# print(tstm_loans_mth_cover_all[1:200,])
Consideration based on formal and informal, where quasi-formal = informal.
# Total number of months with any loans
tstm_loans_mth_all_stats <- tstm_loans_mth_cover_all %>%
  group_by(hhid_Num) %>%
  mutate(mth_span_hh = n())

# Total number of months with any loans
tstm_loans_mth_all_stats <- tstm_loans_mth_all_stats %>%
  mutate(
    has_any =
      case_when(
        formal == TRUE ~ 1,
        informal == TRUE ~ 1,
        TRUE ~ 0
      )
  ) %>%
  group_by(hhid_Num) %>%
  mutate(mth_has_any = sum(has_any))

# Total number of months with only formal loans
tstm_loans_mth_all_stats <- tstm_loans_mth_all_stats %>%
  ungroup() %>%
  mutate(
    has_any =
      case_when(
        formal == TRUE ~ 1,
        TRUE ~ 0
      )
  ) %>%
  group_by(hhid_Num) %>%
  mutate(mth_has_any_formal = sum(has_any))

# Total number of months with only informal loans
tstm_loans_mth_all_stats <- tstm_loans_mth_all_stats %>%
  ungroup() %>%
  mutate(
    has_any =
      case_when(
        informal == TRUE ~ 1,
        TRUE ~ 0
      )
  ) %>%
  group_by(hhid_Num) %>%
  mutate(mth_has_any_informal = sum(has_any))

# Total numbers of joint formal and informal
tstm_loans_mth_all_stats <- tstm_loans_mth_all_stats %>%
  ungroup() %>%
  mutate(
    has_any =
      case_when(
        informal == TRUE & formal == TRUE ~ 1,
        TRUE ~ 0
      )
  ) %>%
  group_by(hhid_Num) %>%
  mutate(mth_has_any_joint = sum(has_any))

# Slice
tstm_loans_mth_all_stats_l1 <- tstm_loans_mth_all_stats %>%
  group_by(hhid_Num) %>%
  slice_head(n = 1) %>%
  select(hhid_Num, starts_with("mth"))

print(tstm_loans_mth_all_stats_l1[1:100, ])
#> # A tibble: 100 × 6
#> # Groups:   hhid_Num [100]
#>    hhid_Num mth_span_hh mth_has_any mth_has_any_formal mth_has_any_informal
#>       <int>       <int>       <dbl>              <dbl>                <dbl>
#>  1     1003          36          28                 19                   25
#>  2     1015           3           0                  0                    0
#>  3     1031         161         156                112                   45
#>  4     1046         161           0                  0                    0
#>  5     1059         161           0                  0                    0
#>  6     1078         161         118                 95                   35
#>  7     1085           3           1                  0                    1
#>  8     1090         161         127                117                   97
#>  9     1099         161         160                148                  160
#> 10     1113         161         145                140                  110
#> # ℹ 90 more rows
#> # ℹ 1 more variable: mth_has_any_joint <dbl>
# write_csv(tstm_loans_mth_all_stats_l1, "../data-raw/tstm_loans_mth_all_stats_l1.csv")
Formal and Informal Alternative Definition
# View(tstm_hh_skeleton)
# 1200. loan span skeleton ----
# 1. long frame, observation is household loan month,
# for each month of each loan for each household

# select loans of one type and generate household loan id
for (bl_formalqf in c(TRUE, FALSE)) {
  tstm_loans_type <- tstm_loans %>%
    filter(formalqf == bl_formalqf) %>%
    arrange(hhid_Num, loan_id) %>%
    group_by(hhid_Num) %>%
    mutate(hh_loan_id = row_number()) %>%
    ungroup()

  tstm_loans_mths <- tstm_loans_type %>%
    select(loan_id, hhid_Num, hh_loan_id, surveymonth, G_Loan_Repaid_Length) %>%
    rename(
      mth_start = surveymonth,
      mth_duration = G_Loan_Repaid_Length
    ) %>%
    uncount(mth_duration) %>%
    group_by(loan_id) %>%
    mutate(surveymonth = row_number() + mth_start - 1) %>%
    ungroup()
  # View(tstm_loans_mths)

  # 1300. Loan long to wide
  # 3. reshape wide, each col is a different loan id, row is a household month, for each household, the number of months/rows is the coverage of loans over the span of the household
  tstm_loans_mth_wide <- tstm_loans_mths %>%
    select(hhid_Num, hh_loan_id, surveymonth) %>%
    arrange(hhid_Num, hh_loan_id, surveymonth) %>%
    mutate(has_loan = 1) %>%
    pivot_wider(
      id_cols = c("hhid_Num", "surveymonth"),
      names_from = "hh_loan_id",
      names_prefix = "loan_",
      values_from = has_loan
    )
  # View(tstm_loans_mth_wide)


  # 4. drop all columns, but keep months and household, these are the months in which this household has these loans
  tstm_loans_mth_cover_type <- tstm_loans_mth_wide %>%
    select(hhid_Num, surveymonth)

  if (bl_formalqf) {
    tstm_loans_mth_cover_formalqf <- tstm_loans_mth_cover_type %>%
      mutate(formalqf = TRUE)
  } else {
    tstm_loans_mth_cover_informalqf <- tstm_loans_mth_cover_type %>%
      mutate(informalqf = TRUE)
  }
}

# Merge formalqf and informalqf
tstm_loans_mth_cover_all <- tstm_hh_skeleton %>%
  left_join(tstm_loans_mth_cover_formalqf,
    by = (c("hhid_Num" = "hhid_Num", "surveymonth" = "surveymonth"))
  ) %>%
  left_join(tstm_loans_mth_cover_informalqf,
    by = (c("hhid_Num" = "hhid_Num", "surveymonth" = "surveymonth"))
  ) %>%
  arrange(hhid_Num, surveymonth)
# Print
# print(tstm_loans_mth_cover_all[1:200,])
Consideration based on formalqf and informalqf, where quasi-formalqf = informalqf.
# Total number of months with any loans
tstm_loans_mth_all_stats <- tstm_loans_mth_cover_all %>%
  group_by(hhid_Num) %>%
  mutate(mth_span_hh = n())

# Total number of months with any loans
tstm_loans_mth_all_stats <- tstm_loans_mth_all_stats %>%
  mutate(
    has_any =
      case_when(
        formalqf == TRUE ~ 1,
        informalqf == TRUE ~ 1,
        TRUE ~ 0
      )
  ) %>%
  group_by(hhid_Num) %>%
  mutate(mth_has_any = sum(has_any))

# Total number of months with only formalqf loans
tstm_loans_mth_all_stats <- tstm_loans_mth_all_stats %>%
  ungroup() %>%
  mutate(
    has_any =
      case_when(
        formalqf == TRUE ~ 1,
        TRUE ~ 0
      )
  ) %>%
  group_by(hhid_Num) %>%
  mutate(mth_has_any_formalqf = sum(has_any))

# Total number of months with only informalqf loans
tstm_loans_mth_all_stats <- tstm_loans_mth_all_stats %>%
  ungroup() %>%
  mutate(
    has_any =
      case_when(
        informalqf == TRUE ~ 1,
        TRUE ~ 0
      )
  ) %>%
  group_by(hhid_Num) %>%
  mutate(mth_has_any_informalqf = sum(has_any))

# Total numbers of joint formalqf and informalqf
tstm_loans_mth_all_stats <- tstm_loans_mth_all_stats %>%
  ungroup() %>%
  mutate(
    has_any =
      case_when(
        informalqf == TRUE & formalqf == TRUE ~ 1,
        TRUE ~ 0
      )
  ) %>%
  group_by(hhid_Num) %>%
  mutate(mth_has_any_joint = sum(has_any))

# Slice
tstm_loans_mth_all_stats_l1_qf <- tstm_loans_mth_all_stats %>%
  group_by(hhid_Num) %>%
  slice_head(n = 1) %>%
  select(hhid_Num, starts_with("mth"))

print(tstm_loans_mth_all_stats_l1_qf[1:100, ])
#> # A tibble: 100 × 6
#> # Groups:   hhid_Num [100]
#>    hhid_Num mth_span_hh mth_has_any mth_has_any_formalqf mth_has_any_informalqf
#>       <int>       <int>       <dbl>                <dbl>                  <dbl>
#>  1     1003          36          28                   19                     25
#>  2     1015           3           0                    0                      0
#>  3     1031         161         156                  112                     45
#>  4     1046         161           0                    0                      0
#>  5     1059         161           0                    0                      0
#>  6     1078         161         118                   95                     35
#>  7     1085           3           1                    0                      1
#>  8     1090         161         127                  117                     97
#>  9     1099         161         160                  154                    155
#> 10     1113         161         145                  140                    110
#> # ℹ 90 more rows
#> # ℹ 1 more variable: mth_has_any_joint <dbl>
# write_csv(tstm_loans_mth_all_stats_l1, "../data-raw/tstm_loans_mth_all_stats_l1.csv")
Overlapping conditional probability visualization
Formal and Informal Definition Main
df_loan_condi <- tstm_loans_mth_all_stats_l1 %>%
  mutate(
    inf_condi_for = mth_has_any_joint / mth_has_any_formal,
    for_condi_inf = mth_has_any_joint / mth_has_any_informal,
    share_has_loan = mth_has_any / mth_span_hh
  ) %>%
  filter(mth_span_hh >= 100) %>%
  ungroup() %>%
  summarize(
    inf_condi_for_mean = mean(inf_condi_for, na.rm = TRUE),
    for_condi_inf_mean = mean(for_condi_inf, na.rm = TRUE),
    share_has_loan_mean = mean(share_has_loan, na.rm = TRUE)
  )
print(df_loan_condi)
#> # A tibble: 1 × 3
#>   inf_condi_for_mean for_condi_inf_mean share_has_loan_mean
#>                <dbl>              <dbl>               <dbl>
#> 1              0.510              0.774               0.769
Probability of formal conditional on informal.
# Color list
ls_colors <- c("P(For=1|Inf=1, Month)" = "blue", "P(Inf=1|For=1, Month)" = "red", "P(Loan|Month)" = "orange")

pl_density_pforcinf <- tstm_loans_mth_all_stats_l1 %>%
  mutate(
    inf_condi_for = mth_has_any_joint / mth_has_any_formal,
    for_condi_inf = mth_has_any_joint / mth_has_any_informal,
    share_has_loan = mth_has_any / mth_span_hh
  ) %>%
  filter(mth_span_hh >= 100) %>%
  ggplot() +
  # geom_density(aes(share_has_loan), alpha=0.5, stat = "density", position = "identity", color="#0072B2") +
  geom_density(aes(x = for_condi_inf, color = "P(For=1|Inf=1, Month)"),
    size = 1,
    alpha = 1, stat = "density", position = "identity"
  ) +
  # geom_density(aes(x = inf_condi_for, color="P(Inf=1|For=1, Month)"), alpha=0.5, stat = "density", position = "identity") +
  scale_color_manual(values = ls_colors, name = "") +
  theme_minimal() +
  labs(
    x = paste0("Conditional probability (share of months, unit-of-obs: household)"),
    y = paste0("Density"),
    title = paste0(
      "Chance in month with informal loan outstanding, there is also formal loan outstanding\n",
      "(Quasi-formal grouped with informal)\n",
      "Solid blue: P(formal = 1 | informal = 1, month)",
      sep = ""
    ),
    caption = paste(
      "Townsend Thai Monthly data up 1998 to 2011",
      sep = ""
    )
  )
#> Warning: Using `size` aesthetic for lines was deprecated in ggplot2 3.4.0.
#> ℹ Please use `linewidth` instead.
print(pl_density_pforcinf)
#> Warning: Removed 102 rows containing non-finite outside the scale range
#> (`stat_density()`).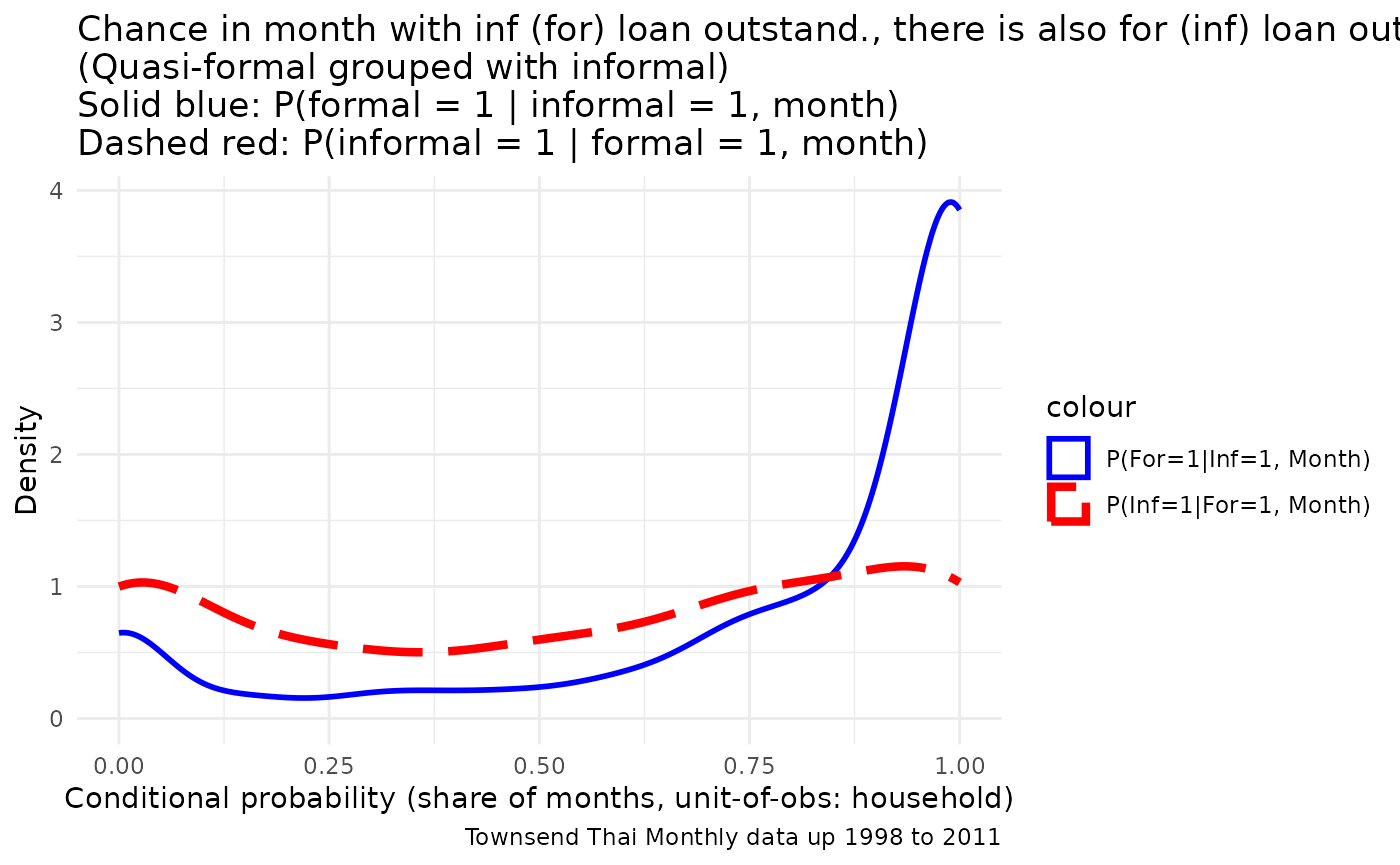
ffp_save_res_figure(pl_density_pforcinf, "pl_density_pforcinf", spt_res, bl_save = ls_save_res[["pl_density_pforcinf"]])Add on to this probability of informal conditional on formal.
pl_density_pforcinf_pinfcfor <- tstm_loans_mth_all_stats_l1 %>%
  mutate(
    inf_condi_for = mth_has_any_joint / mth_has_any_formal,
    for_condi_inf = mth_has_any_joint / mth_has_any_informal,
    share_has_loan = mth_has_any / mth_span_hh
  ) %>%
  filter(mth_span_hh >= 100) %>%
  ggplot() +
  # geom_density(aes(share_has_loan), alpha=0.5, stat = "density", position = "identity", color="#0072B2") +
  geom_density(aes(x = for_condi_inf, color = "P(For=1|Inf=1, Month)"),
    size = 1, stat = "density", position = "identity"
  ) +
  geom_density(aes(x = inf_condi_for, color = "P(Inf=1|For=1, Month)"),
    size = 1.5, linetype = "longdash", stat = "density", position = "identity"
  ) +
  scale_color_manual(values = ls_colors) +
  theme_minimal() +
  labs(
    x = paste0("Conditional probability (share of months, unit-of-obs: household)"),
    y = paste0("Density"),
    title = paste0(
      "Chance in month with inf (for) loan outstand., there is also for (inf) loan outstand.\n",
      "(Quasi-formal grouped with informal)\n",
      "Solid blue: P(formal = 1 | informal = 1, month)\n",
      "Dashed red: P(informal = 1 | formal = 1, month)",
      sep = ""
    ),
    caption = paste(
      "Townsend Thai Monthly data up 1998 to 2011",
      sep = ""
    )
  )
print(pl_density_pforcinf_pinfcfor)
#> Warning: Removed 102 rows containing non-finite outside the scale range
#> (`stat_density()`).
#> Warning: Removed 47 rows containing non-finite outside the scale range
#> (`stat_density()`).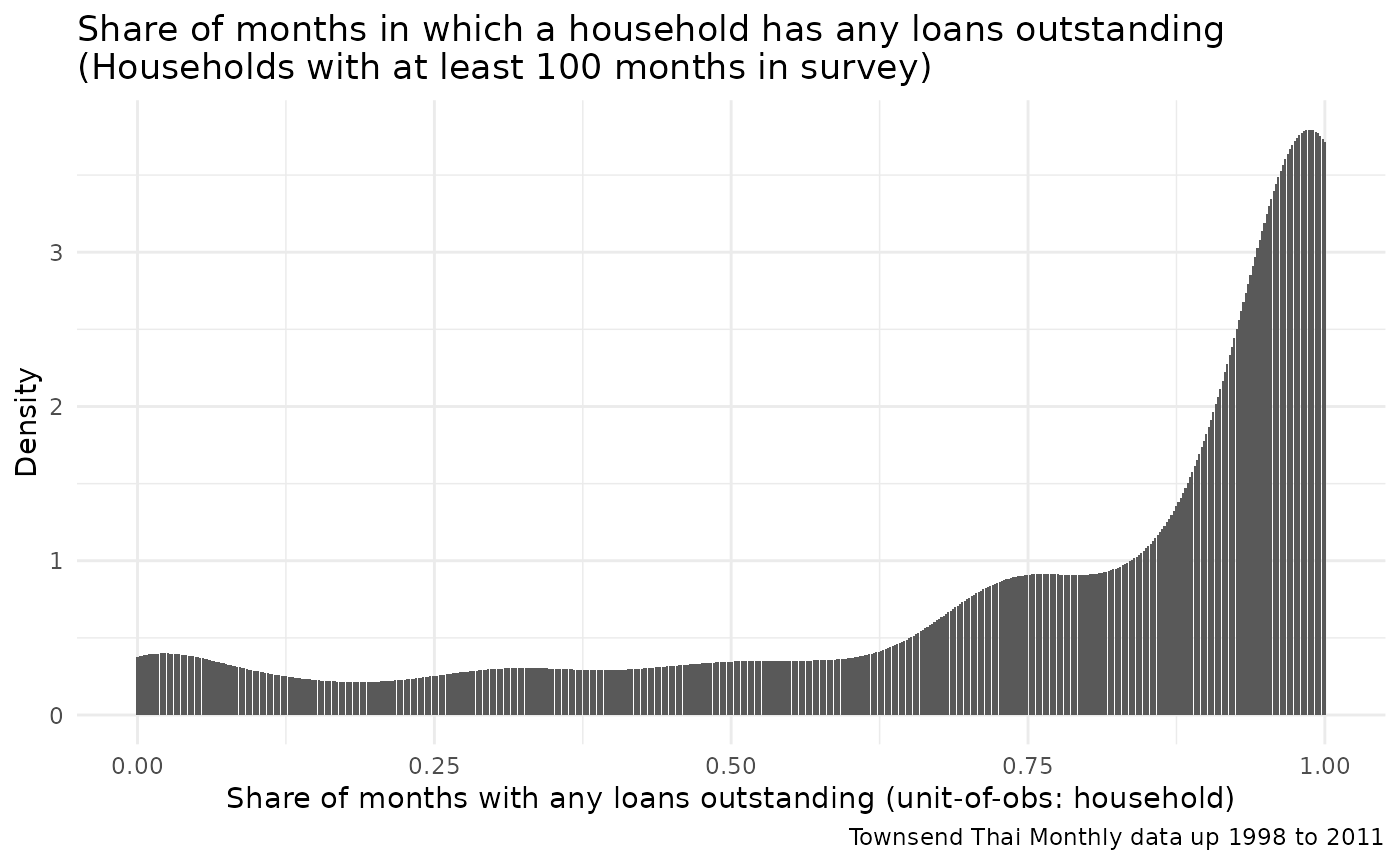
ffp_save_res_figure(pl_density_pforcinf_pinfcfor, "pl_density_pforcinf_pinfcfor", spt_res, bl_save = ls_save_res[["pl_density_pforcinf_pinfcfor"]])
pl_hist_phasloan <- tstm_loans_mth_all_stats_l1 %>%
  mutate(
    inf_condi_for = mth_has_any_joint / mth_has_any_formal,
    for_condi_inf = mth_has_any_joint / mth_has_any_informal,
    share_has_loan = mth_has_any / mth_span_hh
  ) %>%
  filter(mth_span_hh >= 100) %>%
  ggplot() +
  geom_histogram(aes(share_has_loan), stat = "density", position = "identity") +
  theme_minimal() +
  labs(
    x = paste0("Share of months with any loans outstanding (unit-of-obs: household)"),
    y = paste0("Density"),
    title = paste0(
      "Share of months in which a household has any loans outstanding\n",
      "(Households with at least 100 months in survey)",
      sep = ""
    ),
    caption = paste(
      "Townsend Thai Monthly data up 1998 to 2011",
      sep = ""
    )
  )
#> Warning in geom_histogram(aes(share_has_loan), stat = "density", position =
#> "identity"): Ignoring unknown parameters: `binwidth` and `bins`
print(pl_hist_phasloan)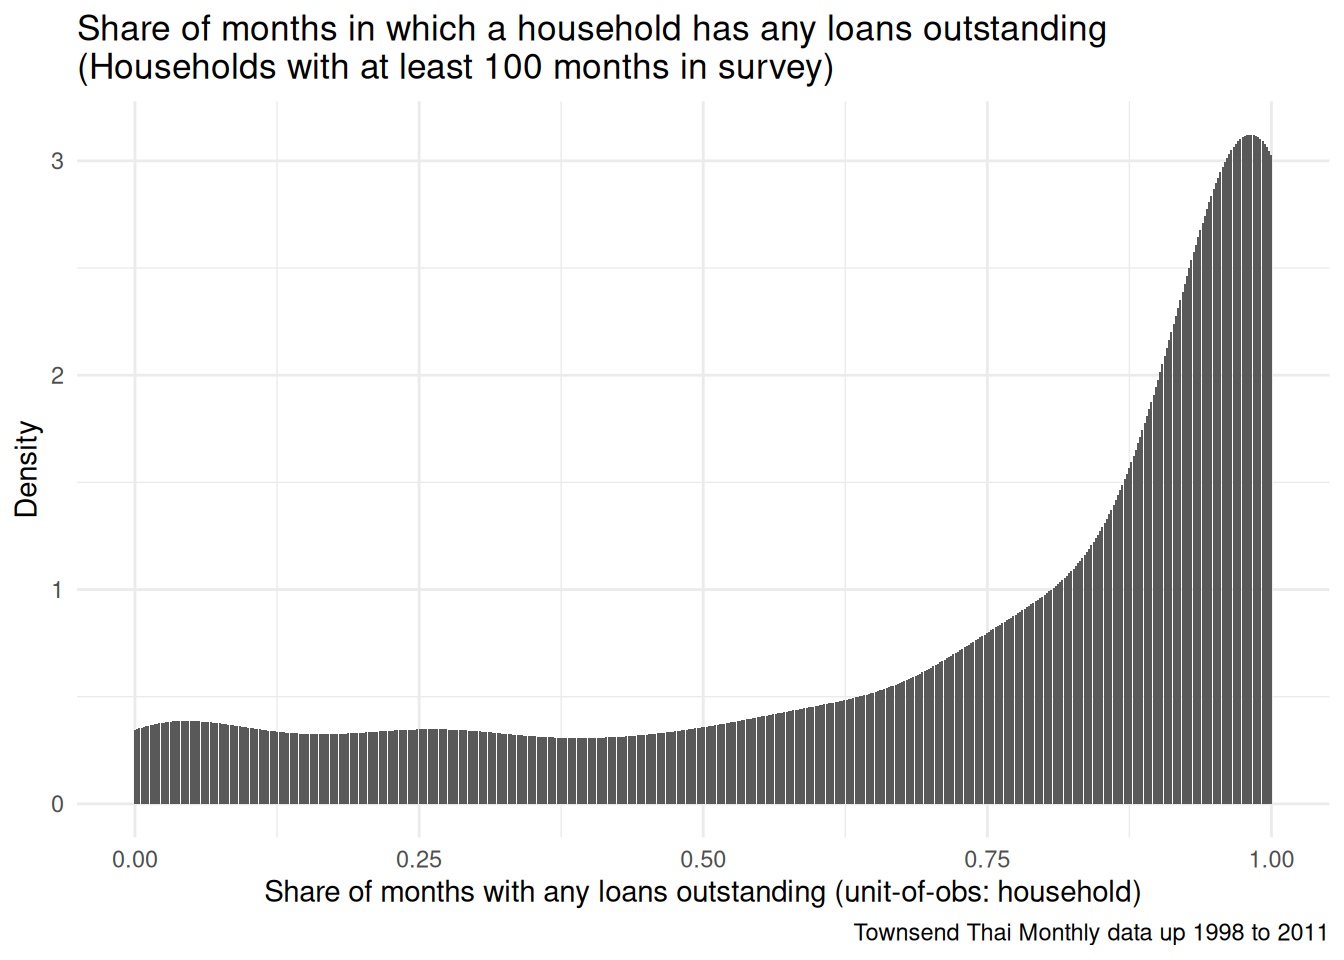
ffp_save_res_figure(pl_hist_phasloan, "pl_hist_phasloan", spt_res, bl_save = ls_save_res[["pl_hist_phasloan"]])Formal and Informal Definition Auxiliary
df_loan_condi <- tstm_loans_mth_all_stats_l1_qf %>%
  mutate(
    inf_condi_for = mth_has_any_joint / mth_has_any_formalqf,
    for_condi_inf = mth_has_any_joint / mth_has_any_informalqf,
    share_has_loan = mth_has_any / mth_span_hh
  ) %>%
  filter(mth_span_hh >= 100) %>%
  ungroup() %>%
  summarize(
    inf_condi_for_mean = mean(inf_condi_for, na.rm = TRUE),
    for_condi_inf_mean = mean(for_condi_inf, na.rm = TRUE),
    share_has_loan_mean = mean(share_has_loan, na.rm = TRUE)
  )
print(df_loan_condi)
#> # A tibble: 1 × 3
#>   inf_condi_for_mean for_condi_inf_mean share_has_loan_mean
#>                <dbl>              <dbl>               <dbl>
#> 1              0.465              0.802               0.769
# Color list
ls_colors <- c("P(For=1|Inf=1, Month)" = "blue", "P(Inf=1|For=1, Month)" = "red", "P(Loan|Month)" = "orange")

pl_for_inf_jnt_1a_qf <- tstm_loans_mth_all_stats_l1_qf %>%
  mutate(
    inf_condi_for = mth_has_any_joint / mth_has_any_formalqf,
    for_condi_inf = mth_has_any_joint / mth_has_any_informalqf,
    share_has_loan = mth_has_any / mth_span_hh
  ) %>%
  filter(mth_span_hh >= 100) %>%
  ggplot() +
  # geom_density(aes(share_has_loan), alpha=0.5, stat = "density", position = "identity", color="#0072B2") +
  geom_density(aes(x = for_condi_inf, color = "P(For=1|Inf=1, Month)"), alpha = 0.5, stat = "density", position = "identity") +
  # geom_density(aes(x = inf_condi_for, color="P(Inf=1|For=1, Month)"), alpha=0.5, stat = "density", position = "identity") +
  scale_color_manual(values = ls_colors) +
  theme_minimal() +
  labs(
    x = paste0("Conditional probaiblity share of months"),
    y = paste0("Density"),
    title = paste(
      "Chance in month with formal (informal) loan outstanding, there is also informal (formal) loan outstanding.\n",
      "P(Has formal loan|Has informal loan, Month)\n",
      "P(Has informal loan|Has formal loan, Month)",
      sep = " "
    ),
    caption = paste(
      "Townsend Thai Monthly data up 1998 to 2011",
      sep = ""
    )
  )
print(pl_for_inf_jnt_1a_qf)
#> Warning: Removed 119 rows containing non-finite outside the scale range
#> (`stat_density()`).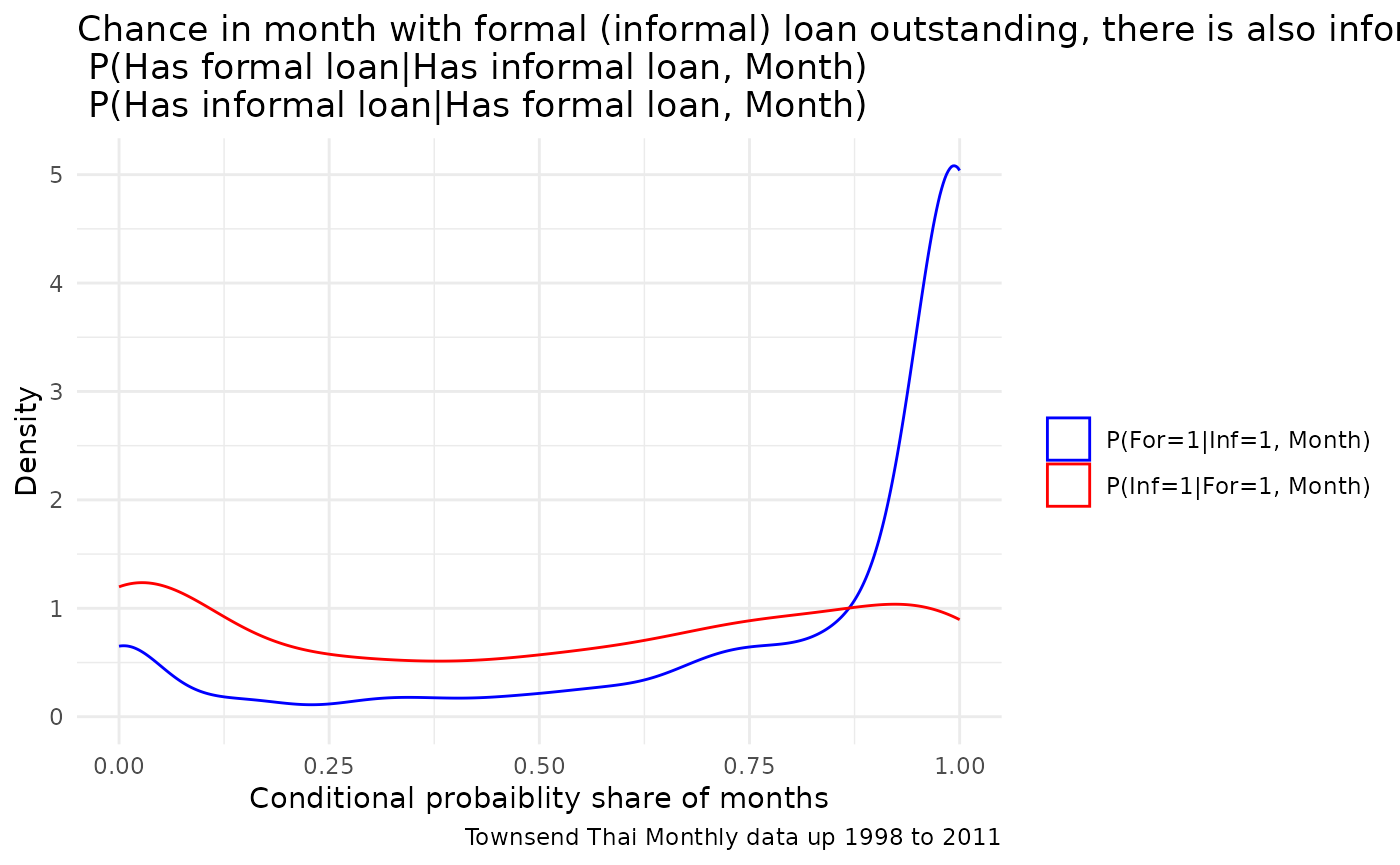
ffp_save_res_figure(pl_for_inf_jnt_1a_qf, "pl_for_inf_jnt_1a_qf", spt_res, bl_save = ls_save_res[["pl_for_inf_jnt_1a_qf"]])
pl_for_inf_jnt_1b_qf <- tstm_loans_mth_all_stats_l1_qf %>%
  mutate(
    inf_condi_for = mth_has_any_joint / mth_has_any_formalqf,
    for_condi_inf = mth_has_any_joint / mth_has_any_informalqf,
    share_has_loan = mth_has_any / mth_span_hh
  ) %>%
  filter(mth_span_hh >= 100) %>%
  ggplot() +
  # geom_density(aes(share_has_loan), alpha=0.5, stat = "density", position = "identity", color="#0072B2") +
  geom_density(aes(x = for_condi_inf, color = "P(For=1|Inf=1, Month)"), alpha = 0.5, stat = "density", position = "identity") +
  geom_density(aes(x = inf_condi_for, color = "P(Inf=1|For=1, Month)"), alpha = 0.5, stat = "density", position = "identity") +
  scale_color_manual(values = ls_colors, name = "") +
  theme_minimal() +
  labs(
    x = paste0("Conditional probaiblity share of months"),
    y = paste0("Density"),
    title = paste(
      "Chance in month with formal (informal) loan outstanding, there is also informal (formal) loan outstanding.\n",
      "P(Has formal loan|Has informal loan, Month)\n",
      "P(Has informal loan|Has formal loan, Month)",
      sep = " "
    ),
    caption = paste(
      "Townsend Thai Monthly data up 1998 to 2011",
      sep = ""
    )
  )
print(pl_for_inf_jnt_1b_qf)
#> Warning: Removed 119 rows containing non-finite outside the scale range
#> (`stat_density()`).
#> Warning: Removed 41 rows containing non-finite outside the scale range
#> (`stat_density()`).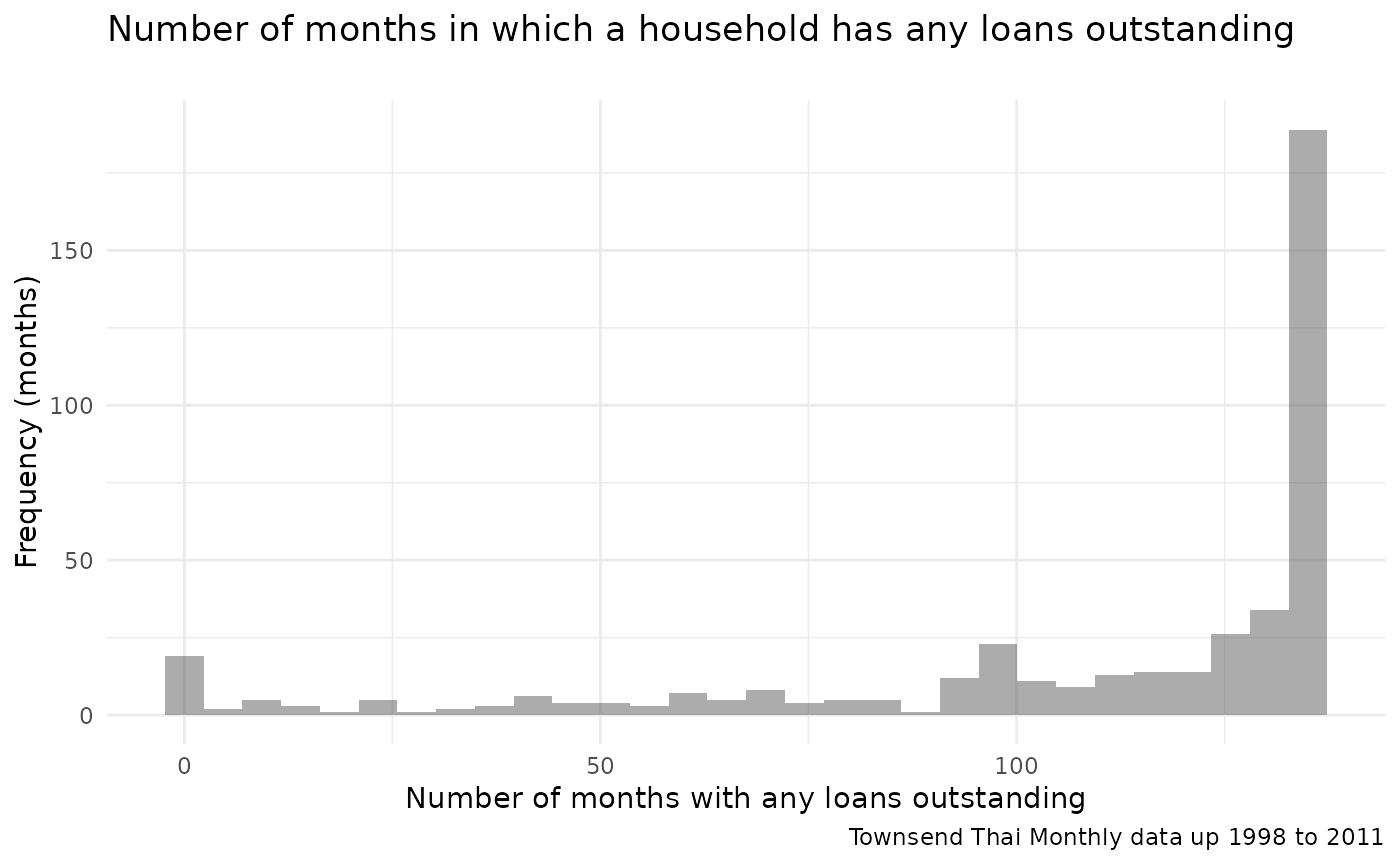
ffp_save_res_figure(pl_for_inf_jnt_1b_qf, "pl_for_inf_jnt_1b_qf", spt_res, bl_save = ls_save_res[["pl_for_inf_jnt_1b_qf"]])
pl_for_inf_jnt_2_qf <- tstm_loans_mth_all_stats_l1_qf %>%
  mutate(
    inf_condi_for = mth_has_any_joint / mth_has_any_formalqf,
    for_condi_inf = mth_has_any_joint / mth_has_any_informalqf,
    share_has_loan = mth_has_any / mth_span_hh
  ) %>%
  filter(mth_span_hh >= 135) %>%
  ggplot() +
  geom_histogram(aes(mth_has_any), alpha = 0.5, stat = "bin", position = "identity") +
  theme_minimal() +
  labs(
    x = paste0("Number of months with any loans outstanding"),
    y = paste0("Frequency (months)"),
    title = paste(
      "Number of months in which a household has any loans outstanding\n",
      # "All loan typess",
      sep = " "
    ),
    caption = paste(
      "Townsend Thai Monthly data up 1998 to 2011",
      sep = ""
    )
  )
print(pl_for_inf_jnt_2_qf)
#> `stat_bin()` using `bins = 30`. Pick better value `binwidth`.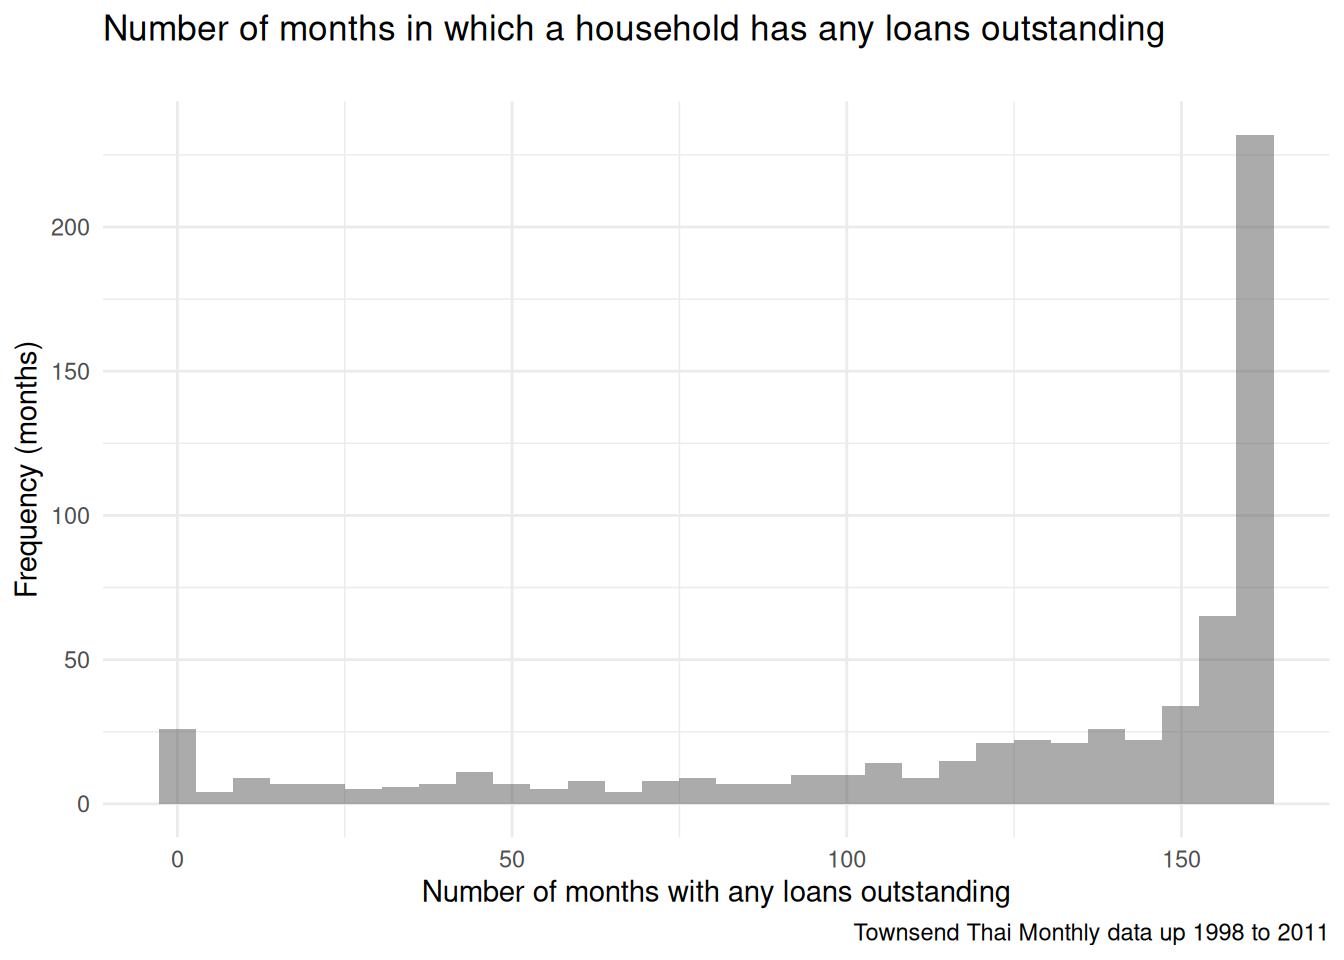
ffp_save_res_figure(pl_for_inf_jnt_2_qf, "pl_for_inf_jnt_2_qf", spt_res, bl_save = ls_save_res[["pl_for_inf_jnt_2_qf"]])Saving Figures
Figures are saved as they are generated above via ffp_save_res_figure(), gated by the per-figure ls_save_res flags defined in the setup chunk (all default FALSE). Set the relevant ls_save_res entry to TRUE to write <name>.png and <name>.eps into res/res_loan_overlap.