Chapter 8 Data Structures
8.1 FF_SAVEBORR_GRID Example for Generating Asset Grid
Go back to fan’s MEconTools Toolbox (bookdown), Matlab Code Examples Repository (bookdown), or Math for Econ with Matlab Repository (bookdown).
Examples](https://fanwangecon.github.io/M4Econ/), or** Dynamic Asset This is the example vignette for function: ff_saveborr_grid from the MEconTools Package. This function generates variously spaced savings/borrowing states/choices grid.
8.1.1 Test FF_SAVEBORR_GRID Defaults
Call the function with defaults.
ff_saveborr_grid();
----------------------------------------
xxxxxxxxxxxxxxxxxxxxxxxxxxxxxxxxxxxxxxxx
CONTAINER NAME: mp_container_map ND Array (Matrix etc)
xxxxxxxxxxxxxxxxxxxxxxxxxxxxxxxxxxxxxxxx
i idx ndim numel rowN colN sum mean std coefvari min max
_ ___ ____ _____ ____ ____ ______ ______ ______ ________ ___ ___
ar_fl_saveborr 1 1 2 25 25 1 385.93 15.437 15.324 0.99265 1 50
xxx TABLE:ar_fl_saveborr xxxxxxxxxxxxxxxxxx
c1
______
r1 1
r2 1.0174
r3 1.0982
r4 1.2707
r5 1.5557
r6 1.9707
r7 2.5312
r8 3.2512
r9 4.1434
r10 5.2196
r11 6.4912
r12 7.9687
r13 9.6621
r14 11.581
r15 13.735
r16 16.132
r17 18.781
r18 21.691
r19 24.87
r20 28.324
r21 32.063
r22 36.093
r23 40.421
r24 45.054
r25 50
----------------------------------------
xxxxxxxxxxxxxxxxxxxxxxxxxxxxxxxxxxxxxxxx
CONTAINER NAME: mp_container_map Scalars
xxxxxxxxxxxxxxxxxxxxxxxxxxxxxxxxxxxxxxxx
i idx value
_ ___ _____
grid_evenlog_threshold 1 2 1
grid_log10space_x1 2 3 0.3
grid_log10space_x2 3 4 3
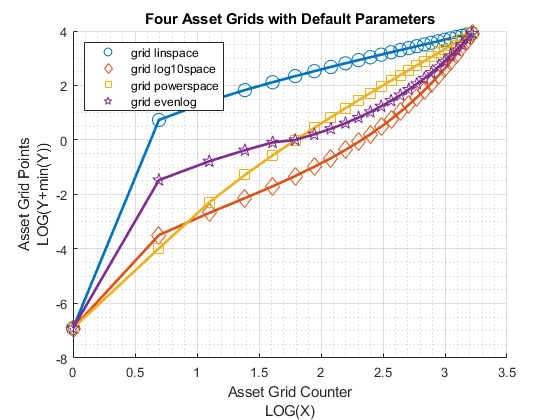
grid_powerspace_power 4 5 2.5 8.1.2 Test FF_SAVEBORR_GRID Default Linear Grid, Log Grid, Power Grid, Threshold Grid
Call the function with defaults.
% Same min and max and grid points
[fl_a_min, fl_a_max, it_a_points] = deal(0,50,25);
% Four types of grid points
st_grid_type = 'grid_linspace';
[ar_fl_saveborr_linspace] = ff_saveborr_grid(fl_a_min, fl_a_max, it_a_points, st_grid_type);
st_grid_type = 'grid_log10space';
[ar_fl_saveborr_log10space] = ff_saveborr_grid(fl_a_min, fl_a_max, it_a_points, st_grid_type);
st_grid_type = 'grid_powerspace';
[ar_fl_saveborr_powerspace] = ff_saveborr_grid(fl_a_min, fl_a_max, it_a_points, st_grid_type);
st_grid_type = 'grid_evenlog';
[ar_fl_saveborr_evenlog] = ff_saveborr_grid(fl_a_min, fl_a_max, it_a_points, st_grid_type);
% draw four types of lines jointly
mt_value = [ar_fl_saveborr_linspace'; ar_fl_saveborr_log10space'; ...
    ar_fl_saveborr_powerspace'; ar_fl_saveborr_evenlog'];
ar_row_grid = ["grid linspace", "grid log10space", "grid powerspace", "grid evenlog"];
ar_col_grid = 1:it_a_points;
mp_support_graph = containers.Map('KeyType', 'char', 'ValueType', 'any');
mp_support_graph('cl_st_graph_title') = {'Four Asset Grids with Default Parameters'};
mp_support_graph('cl_st_ytitle') = {'Asset Grid Points'};
mp_support_graph('cl_st_xtitle') = {'Asset Grid Counter'};
mp_support_graph('bl_graph_logy') = true; % do not log
ff_graph_grid(mt_value, ar_row_grid, ar_col_grid, mp_support_graph);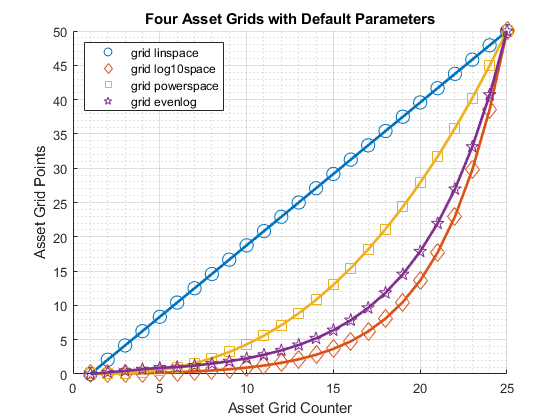
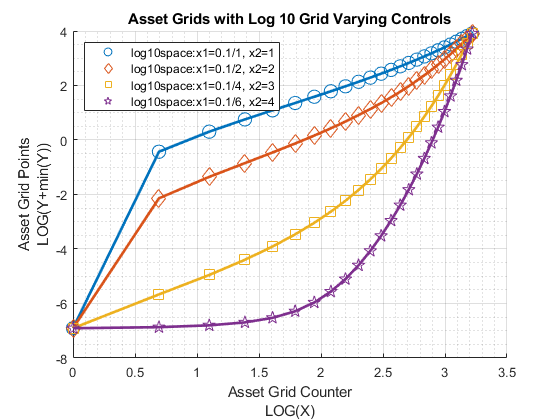
8.1.3 Test FF_SAVEBORR_GRID Log Grid Changing Parameters
Log grid, same min and max, change log X1 and X2 points
% Same min and max and grid points
[fl_a_min, fl_a_max, it_a_points] = deal(0,50,25);
st_grid_type = 'grid_log10space';
% Four types of grid points
mp_grid_control = containers.Map('KeyType','char', 'ValueType','any');
mp_grid_control('grid_log10space_x1') = 0.1;
mp_grid_control('grid_log10space_x2') = 1;
[ar_fl_log10space_a] = ff_saveborr_grid(fl_a_min, fl_a_max, it_a_points, st_grid_type, mp_grid_control);
mp_grid_control('grid_log10space_x1') = 0.1/2;
mp_grid_control('grid_log10space_x2') = 1*2;
[ar_fl_log10space_b] = ff_saveborr_grid(fl_a_min, fl_a_max, it_a_points, st_grid_type, mp_grid_control);
mp_grid_control('grid_log10space_x1') = 0.1/4;
mp_grid_control('grid_log10space_x2') = 1*4;
[ar_fl_log10space_c] = ff_saveborr_grid(fl_a_min, fl_a_max, it_a_points, st_grid_type, mp_grid_control);
mp_grid_control('grid_log10space_x1') = 0.1/6;
mp_grid_control('grid_log10space_x2') = 1*6;
[ar_fl_log10space_d] = ff_saveborr_grid(fl_a_min, fl_a_max, it_a_points, st_grid_type, mp_grid_control);
% draw four types of lines jointly
mt_value = [ar_fl_log10space_a'; ar_fl_log10space_b'; ...
    ar_fl_log10space_c'; ar_fl_log10space_d'];
ar_row_grid = [...
    "log10space:x1=0.1/1, x2=1", ...
    "log10space:x1=0.1/2, x2=2", ...
    "log10space:x1=0.1/4, x2=3", ...
    "log10space:x1=0.1/6, x2=4"];
ar_col_grid = 1:it_a_points;
mp_support_graph = containers.Map('KeyType', 'char', 'ValueType', 'any');
mp_support_graph('cl_st_graph_title') = {'Asset Grids with Log 10 Grid Varying Controls'};
mp_support_graph('cl_st_ytitle') = {'Asset Grid Points'};
mp_support_graph('cl_st_xtitle') = {'Asset Grid Counter'};
mp_support_graph('bl_graph_logy') = true; % do not log
ff_graph_grid(mt_value, ar_row_grid, ar_col_grid, mp_support_graph);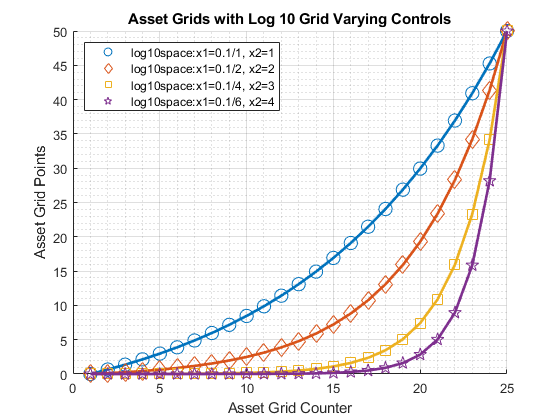
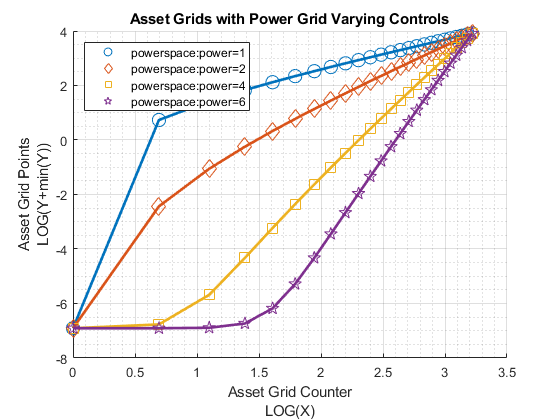
8.1.4 Test FF_SAVEBORR_GRID Power Grid Changing Parameters
Log grid, same min and max, change log X1 and X2 points
% Same min and max and grid points
[fl_a_min, fl_a_max, it_a_points] = deal(0,50,25);
st_grid_type = 'grid_powerspace';
% Four types of grid points
mp_grid_control = containers.Map('KeyType','char', 'ValueType','any');
mp_grid_control('grid_powerspace_power') = 1;
[ar_fl_powerspace_a] = ff_saveborr_grid(fl_a_min, fl_a_max, it_a_points, st_grid_type, mp_grid_control);
mp_grid_control('grid_powerspace_power') = 2;
[ar_fl_powerspace_b] = ff_saveborr_grid(fl_a_min, fl_a_max, it_a_points, st_grid_type, mp_grid_control);
mp_grid_control('grid_powerspace_power') = 4;
[ar_fl_powerspace_c] = ff_saveborr_grid(fl_a_min, fl_a_max, it_a_points, st_grid_type, mp_grid_control);
mp_grid_control('grid_powerspace_power') = 6;
[ar_fl_powerspace_d] = ff_saveborr_grid(fl_a_min, fl_a_max, it_a_points, st_grid_type, mp_grid_control);
% draw four types of lines jointly
mt_value = [ar_fl_powerspace_a'; ar_fl_powerspace_b'; ...
    ar_fl_powerspace_c'; ar_fl_powerspace_d'];
ar_row_grid = [...
    "powerspace:power=1", ...
    "powerspace:power=2", ...
    "powerspace:power=4", ...
    "powerspace:power=6"];
ar_col_grid = 1:it_a_points;
mp_support_graph = containers.Map('KeyType', 'char', 'ValueType', 'any');
mp_support_graph('cl_st_graph_title') = {'Asset Grids with Power Grid Varying Controls'};
mp_support_graph('cl_st_ytitle') = {'Asset Grid Points'};
mp_support_graph('cl_st_xtitle') = {'Asset Grid Counter'};
mp_support_graph('bl_graph_logy') = true; % do not log
ff_graph_grid(mt_value, ar_row_grid, ar_col_grid, mp_support_graph);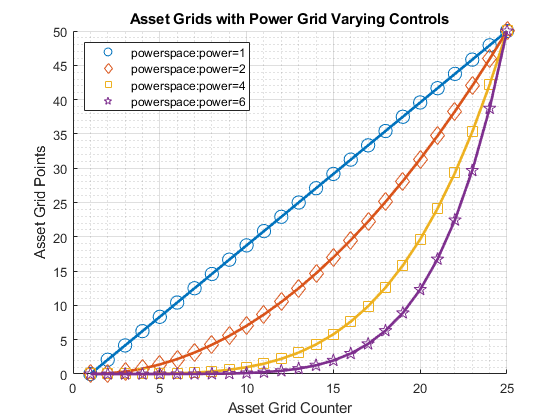
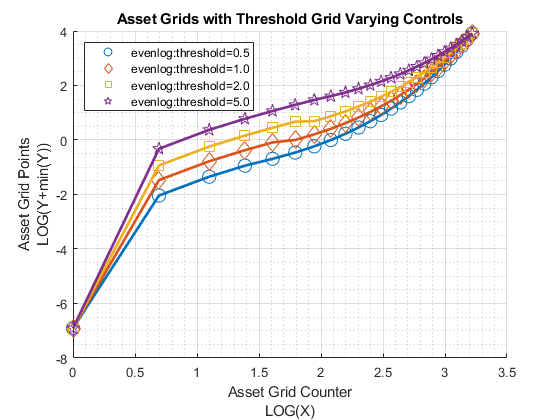
8.1.5 Test FF_SAVEBORR_GRID Threshold Grid Changing Parameters
Threshold Grid, Changing Threshold Levels. Initial segments below threshold are linspace, then logspace.
% Same min and max and grid points
[fl_a_min, fl_a_max, it_a_points] = deal(0,50,25);
st_grid_type = 'grid_evenlog';
% Four types of grid points
mp_grid_control = containers.Map('KeyType','char', 'ValueType','any');
mp_grid_control('grid_evenlog_threshold') = 0.50;
[ar_fl_evenlog_a] = ff_saveborr_grid(fl_a_min, fl_a_max, it_a_points, st_grid_type, mp_grid_control);
mp_grid_control('grid_evenlog_threshold') = 1.00;
[ar_fl_evenlog_b] = ff_saveborr_grid(fl_a_min, fl_a_max, it_a_points, st_grid_type, mp_grid_control);
mp_grid_control('grid_evenlog_threshold') = 2;
[ar_fl_evenlog_c] = ff_saveborr_grid(fl_a_min, fl_a_max, it_a_points, st_grid_type, mp_grid_control);
mp_grid_control('grid_evenlog_threshold') = 5;
[ar_fl_evenlog_d] = ff_saveborr_grid(fl_a_min, fl_a_max, it_a_points, st_grid_type, mp_grid_control);
% draw four types of lines jointly
mt_value = [ar_fl_evenlog_a'; ar_fl_evenlog_b'; ...
    ar_fl_evenlog_c'; ar_fl_evenlog_d'];
ar_row_grid = [...
    "evenlog:threshold=0.5", ...
    "evenlog:threshold=1.0", ...
    "evenlog:threshold=2.0", ...
    "evenlog:threshold=5.0"];
ar_col_grid = 1:it_a_points;
mp_support_graph = containers.Map('KeyType', 'char', 'ValueType', 'any');
mp_support_graph('cl_st_graph_title') = {'Asset Grids with Threshold Grid Varying Controls'};
mp_support_graph('cl_st_ytitle') = {'Asset Grid Points'};
mp_support_graph('cl_st_xtitle') = {'Asset Grid Counter'};
mp_support_graph('bl_graph_logy') = true; % do not log
ff_graph_grid(mt_value, ar_row_grid, ar_col_grid, mp_support_graph);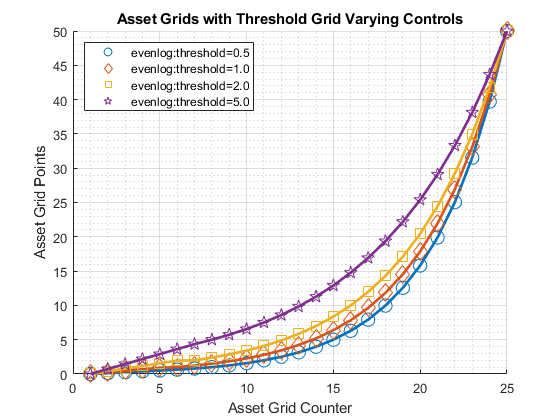
8.2 FX_PERTURB_LOGN Perturb Parameter with Logn Scalar
Go back to fan’s MEconTools Toolbox (bookdown), Matlab Code Examples Repository (bookdown), or Math for Econ with Matlab Repository (bookdown).
Examples](https://fanwangecon.github.io/M4Econ/), or** Dynamic Asset This is the example vignette for function: ff_perturb_logn from the MEconTools Package. This function randomly perturb some existing parameter. See Randomly Perturb Some Parameter Value with Varying Magnitudes.
8.2.1 Test FX_PERTURB_LOGN Defaults
Call the function with defaults.
ff_perturb_logn();

----------------------------------------
xxxxxxxxxxxxxxxxxxxxxxxxxxxxxxxxxxxxxxxx
CONTAINER NAME: mp_container_map Scalars
xxxxxxxxxxxxxxxxxxxxxxxxxxxxxxxxxxxxxxxx
                        i    idx     value
                        _    ___    _______

    ar_logn_sd          1     1     0.20534
    fl_draw_znorm       2     2      -0.343
    logn_coef_of_var    3     3       24.35
    param_original      4     4           5
    param_perturbed     5     5      4.9296
    scaler_0t1          6     6      0.1008
8.2.2 Test FX_PERTURB_LOGN with Different Draws and How much to Perturb
Call the function with defaults.
% Collect
mp_container_map = containers.Map('KeyType','char', 'ValueType','any');
% Loop over different scalars
param_original = 5;
ar_scaler_0t1 = linspace(0,1,11);
it_scalar_ctr = 0;
for scaler_0t1=ar_scaler_0t1
    it_scalar_ctr = it_scalar_ctr + 1;
    % Generate differently perturbed parameters
    ar_param_perturbed = NaN(1,5000);
    for it_rand_seed=1:5000
        param_perturbed = ff_perturb_logn(param_original, it_rand_seed, scaler_0t1);
        ar_param_perturbed(it_rand_seed) = param_perturbed;
    end
    % Collect
    mp_container_map(['PERTURB_SCALAR_' num2str(scaler_0t1)]) = ar_param_perturbed;
end
% Display
ff_container_map_display(mp_container_map);

----------------------------------------
xxxxxxxxxxxxxxxxxxxxxxxxxxxxxxxxxxxxxxxx
CONTAINER NAME: mp_container_map ND Array (Matrix etc)
xxxxxxxxxxxxxxxxxxxxxxxxxxxxxxxxxxxxxxxx
                          i     idx    ndim    numel    rowN    colN        sum         mean         std        coefvari       min       max
                          __    ___    ____    _____    ____    ____    ___________    _______    _________    __________    _______    ______

    PERTURB_SCALAR_0       1     1      2      5000      1      5000          25000     4.9999    0.0022357    0.00044715     4.9922    5.0095
    PERTURB_SCALAR_0_1     2     2      2      5000      1      5000          24963     4.9926      0.20802      0.041665     4.2759    5.8859
    PERTURB_SCALAR_0_2     3     3      2      5000      1      5000          24889     4.9779      0.62106       0.12476      2.838    7.6451
    PERTURB_SCALAR_0_3     4     4      2      5000      1      5000          24756     4.9512       1.3692       0.27654    0.23359    10.831
    PERTURB_SCALAR_0_4     5     5      2      5000      1      5000          24521     4.9041       2.6921       0.54893    -4.3712    16.465
    PERTURB_SCALAR_0_5     6     6      2      5000      1      5000          24098     4.8196       5.0651        1.0509    -12.632    26.572
    PERTURB_SCALAR_0_6     7     7      2      5000      1      5000          23303     4.6606       9.5301        2.0448    -28.175    45.588
    PERTURB_SCALAR_0_7     8     8      2      5000      1      5000          21664     4.3328       18.737        4.3245    -60.225      84.8
    PERTURB_SCALAR_0_8     9     9      2      5000      1      5000          17645      3.529       41.309        11.705     -138.8    180.93
    PERTURB_SCALAR_0_9    10    10      2      5000      1      5000         3041.2    0.60824       123.33        202.77    -424.33    530.27
    PERTURB_SCALAR_1      11    11      2      5000      1      5000    -2.0181e+06    -403.62        11475       -28.431     -39942     48878
8.3 FF_SAVEBORR_GRID Example for Generating Asset Grid
Go back to fan’s MEconTools Toolbox (bookdown), Matlab Code Examples Repository (bookdown), or Math for Econ with Matlab Repository (bookdown).
This is the example vignette for function: ff_nonimg_posnegbd from the MEconTools Package. This function checks for valid domain for function that generates real-valued outcomes, and identifies values along the domain that generates positive and negative Values.
8.3.1 Test FF_NONIMG_POSNEGBD Defaults
Call the function with defaults.
ff_nonimg_posnegbd();

FF_NONIMG_POSNEGBD;it_exit_condition=6;bl_has_increase=0;bl_has_decrease=1;bl_has_constant=0;bl_has_pos=0;bl_has_neg=1;bl_has_zero=0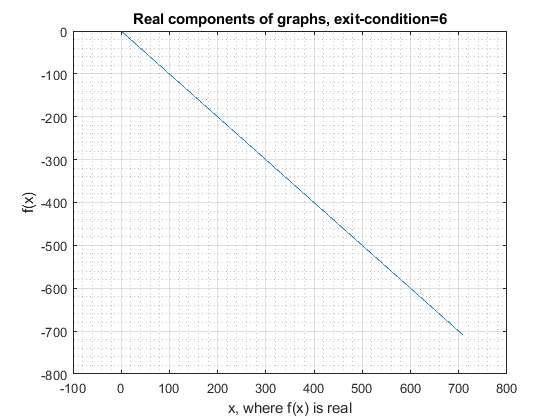
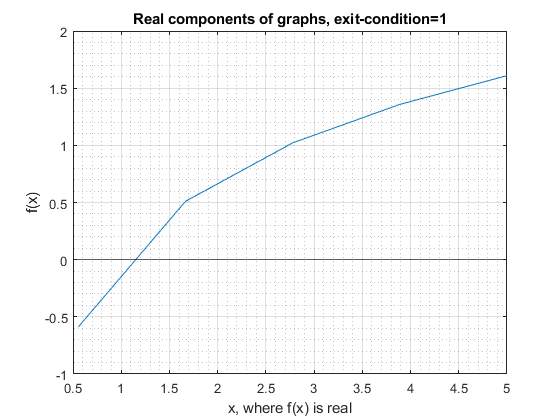
8.3.2 Test FF_NONIMG_POSNEGBD with Log(x)
Testing the function with log(x)
% Same min and max and grid points
[fl_x_min, fl_x_max, it_eval_points, it_eval_max_round, bl_loop] = deal(-5, 5, 10, 3, true);
[bl_verbose, bl_timer] = deal(true, true);
fc_eval = @(x) log(x);
% Solve
[ar_x_points_noimg, ar_obj_eval_noimg, aar_obj_eval_noimg] = ...
    ff_nonimg_posnegbd(fl_x_min, fl_x_max, fc_eval, it_eval_points, it_eval_max_round, bl_loop, ...
    bl_verbose, bl_timer);

FF_NONIMG_POSNEGBD;it_exit_condition=1;bl_has_increase=1;bl_has_decrease=0;bl_has_constant=0;bl_has_pos=1;bl_has_neg=1;bl_has_zero=0