Chapter 6 Graphs
6.1 FF_GRAPH_GRID Examples: X, Y and Color Line Plots
Go back to fan’s MEconTools Toolbox (bookdown), Matlab Code Examples Repository (bookdown), or Math for Econ with Matlab Repository (bookdown).
Examples](https://fanwangecon.github.io/M4Econ/), or** Dynamic Asset This is the example vignette for function: ff_graph_grid from the MEconTools Package. This function can graph out value and policy functions given one state vector (x-axis), conditional on other states (line groups). Can handle a few lines (scatter + lines), or many groups (jet spectrum). Can handle policy and value function graphs, or distributional plots.
6.1.1 Test FF_GRAPH_GRID Defaults
Call the function with defaults.
ff_graph_grid();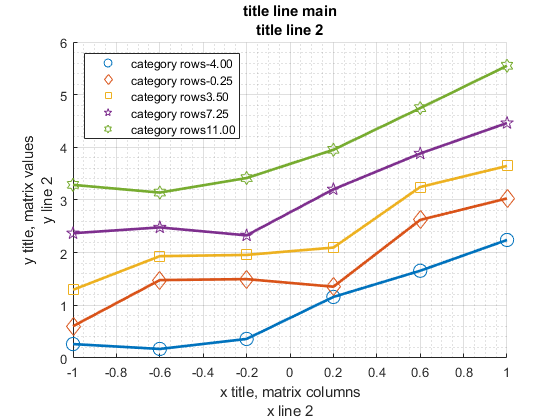
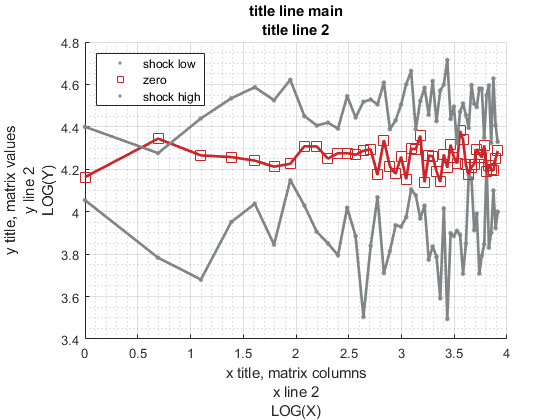
6.1.2 Test FF_GRAPH_GRID Random Matrix Pick Markers and Colors
Call the function with defaults. Graph a matrix, each row of the matrix is a separate line, each column a point along the x-axis, value of the matrix are plotting on the y-axis.
ar_row_grid: the values associated with each row, what will show up in the legend
ar_col_grid: the values associated with each column
mt_support_graph: various controls, color, etc...
rng(123);
mt_value = [normrnd(50,10,[1, 50]); ...
            normrnd(70,5,[1, 50]);...
            normrnd(90,10,[1, 50])];
ar_row_grid = ["shock low", "zero", "shock high"];
ar_col_grid = 1:50;
mp_support_graph = containers.Map('KeyType', 'char', 'ValueType', 'any');
mp_support_graph('cl_scatter_shapes') = { '.', 's' ,'.' };
mp_support_graph('cl_colors') = {'gray', 'red', 'gray'};
ff_graph_grid(mt_value, ar_row_grid, ar_col_grid, mp_support_graph);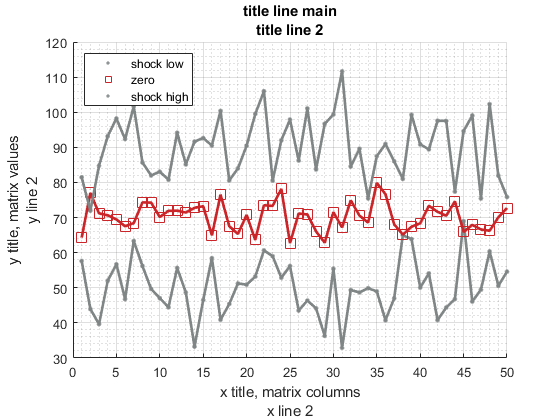
6.1.3 Test FF_GRAPH_GRID Two Random Normal Lines and Labels
There are two autoregressive time series, plot out the time two time series.
% Generate the two time series
rng(456);
mt_value = normrnd(100,10,[2, 50]);
ar_row_grid = ["individual 1", "individual 2"];
ar_col_grid = 1:50;
mp_support_graph = containers.Map('KeyType', 'char', 'ValueType', 'any');
mp_support_graph('cl_st_graph_title') = {'Time Series Two Individuals'};
mp_support_graph('cl_st_ytitle') = {'Values'};
mp_support_graph('cl_st_xtitle') = {'Periods'};
mp_support_graph('bl_graph_logy') = false; % do not log
ff_graph_grid(mt_value, ar_row_grid, ar_col_grid, mp_support_graph);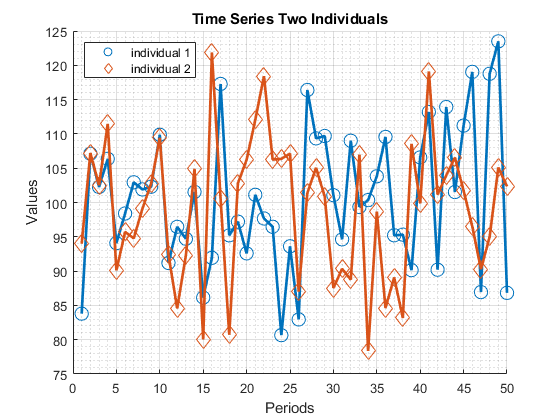
6.1.4 Test FF_GRAPH_GRID 6 Lines Pick Marker and Colors
Plot many lines, with auto legend.
% Generate some Data
rng(456);
ar_row_grid = linspace(-4, 11, 5);
ar_col_grid = linspace(-1, 1, 20);
rng(123);
mt_value = 0.2*ar_row_grid' + exp(ar_col_grid) + rand([length(ar_row_grid), length(ar_col_grid)]);
% container map settings
mp_support_graph = containers.Map('KeyType', 'char', 'ValueType', 'any');
mp_support_graph('cl_st_graph_title') = {'5 lines, specify marker and color, value(a,z), a=x, z=color'};
mp_support_graph('cl_st_ytitle') = {'value(a,z)'};
mp_support_graph('cl_st_xtitle') = {'Savings States, a'};
mp_support_graph('st_legend_loc') = 'southeast';
mp_support_graph('bl_graph_logy') = false; % do not log
mp_support_graph('st_rowvar_name') = 'z=';
mp_support_graph('it_legend_select') = 3; % how many shock legends to show
mp_support_graph('st_rounding') = '6.2f'; % format shock legend
mp_support_graph('cl_scatter_shapes') = {'s', 's', '*', '*', 'p'};
mp_support_graph('cl_colors') = {'green', 'black', 'green', 'black', 'orange'};
% Call function
ff_graph_grid(mt_value, ar_row_grid, ar_col_grid, mp_support_graph);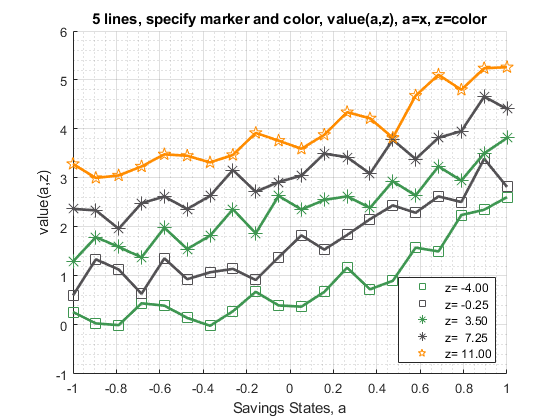
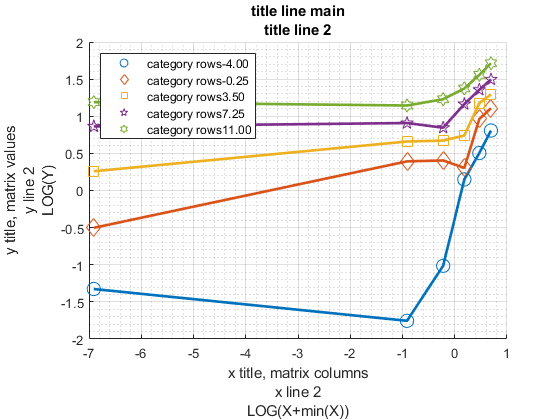
6.1.5 Test FF_GRAPH_GRID Many Lines
Plot many lines, with auto legend.
% Generate some Data
rng(456);
ar_row_grid = linspace(-4, 11, 100);
ar_col_grid = linspace(-1, 1, 1000);
rng(123);
mt_value = 0.2*ar_row_grid' + exp(ar_col_grid) + rand([length(ar_row_grid), length(ar_col_grid)]);
% container map settings
mp_support_graph = containers.Map('KeyType', 'char', 'ValueType', 'any');
mp_support_graph('cl_st_graph_title') = {'value(a,z), a=x, z=color'};
mp_support_graph('cl_st_ytitle') = {'value(a,z)'};
mp_support_graph('cl_st_xtitle') = {'Savings States, a'};
mp_support_graph('st_legend_loc') = 'southeast';
mp_support_graph('bl_graph_logy') = false; % do not log
mp_support_graph('st_rowvar_name') = 'z=';
mp_support_graph('it_legend_select') = 3; % how many shock legends to show
mp_support_graph('st_rounding') = '6.2f'; % format shock legend
mp_support_graph('cl_colors') = 'jet'; % any predefined matlab colormap
% Call function
ff_graph_grid(mt_value, ar_row_grid, ar_col_grid, mp_support_graph);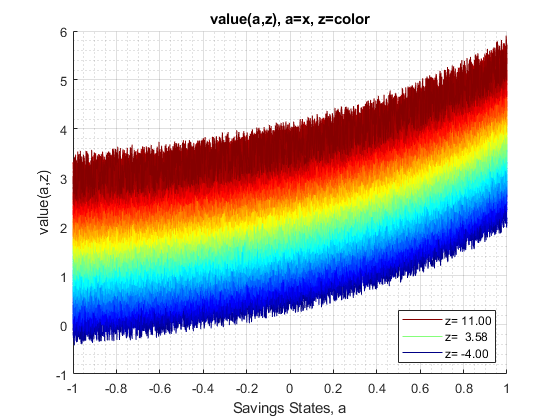
6.1.6 Test FF_GRAPH_GRID Many Lines Legend Exogenous
Plot many lines, exogenously set legend
% Generate the two time series
rng(456);
ar_row_grid = linspace(-4, 11, 15);
ar_col_grid = linspace(-1, 1, 100000);
rng(123);
mt_value = 0.2*ar_row_grid' - exp(ar_col_grid) + rand([length(ar_row_grid), length(ar_col_grid)]);
% setting shock vector name exogenously here
ar_row_grid = string(num2str(ar_row_grid', "shock=%6.2f"));
% container map settings
mp_support_graph = containers.Map('KeyType', 'char', 'ValueType', 'any');
mp_support_graph('cl_st_graph_title') = {'value(a,z), a=x, z=color'};
mp_support_graph('cl_st_ytitle') = {'value(a,z)'};
mp_support_graph('cl_st_xtitle') = {'Savings States, a'};
mp_support_graph('st_legend_loc') = 'eastoutside';
mp_support_graph('bl_graph_logy') = false; % do not log
mp_support_graph('it_legend_select') = 15;
mp_support_graph('cl_colors') = 'winter'; % any predefined matlab colormap
% Call function
ff_graph_grid(mt_value, ar_row_grid, ar_col_grid, mp_support_graph);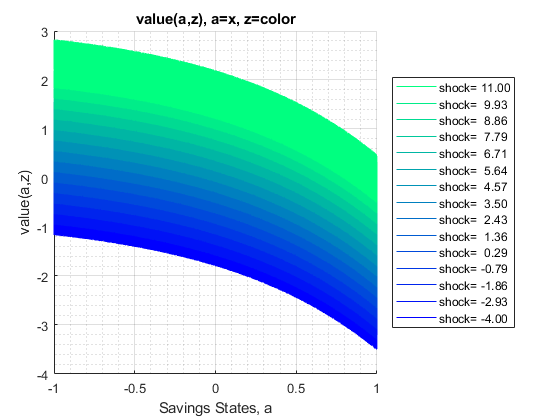
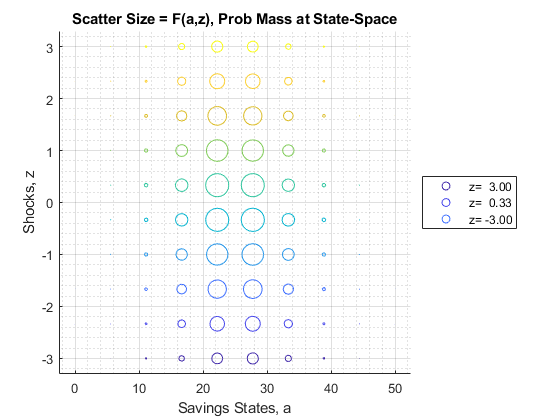
6.1.7 Test FF_GRAPH_GRID Joint Probability Mass Output as Scatter Size
Along two dimensions of the state-space, we might want to visualize the probability mass distribution P(a,z) . We will show A and Z as the X and Y dimensions, and use Scatter size for mass at each point.
In the default mode, each ar_row_grid can be a string array, providing labels for each data matrix row, shown with different colors. Here, the ar_row_grid must be numeric.
% Joint Normal Mass
rng(456);
mu = [0 25];
sigma = [3 -0.3; -0.3 25];
ar_z = linspace(-3, 3, 10);
ar_a = linspace(0, 50, 10);
[mt_a, mt_z] = meshgrid(ar_a, ar_z);
mt_x = [mt_z(:) mt_a(:)];
ar_prob = mvnpdf(mt_x, mu, sigma);
mt_prob = reshape(ar_prob,length(ar_a),length(ar_z));
mt_prob = mt_prob/sum(mt_prob, 'all');
% container map settings
mp_support_graph = containers.Map('KeyType', 'char', 'ValueType', 'any');
mp_support_graph('cl_st_graph_title') = {'Scatter Size = F(a,z), Prob Mass at State-Space'};
mp_support_graph('cl_st_ytitle') = {'Shocks, z'};
mp_support_graph('cl_st_xtitle') = {'Savings States, a'};
mp_support_graph('st_legend_loc') = 'eastoutside';
mp_support_graph('bl_graph_logy') = false; % do not log
mp_support_graph('st_rowvar_name') = 'z=';
mp_support_graph('it_legend_select') = 3; % how many shock legends to show
mp_support_graph('st_rounding') = '6.2f'; % format shock legend
mp_support_graph('cl_colors') = 'parula'; % any predefined matlab colormap
mp_support_graph('it_dist_csize_multiple') = 5000;

% Call function
ar_row_grid = ar_z;
ar_col_grid = ar_a;
st_figtype = 'dist';
ff_graph_grid(mt_prob, (ar_z), ar_col_grid, mp_support_graph, st_figtype);