Compare Raw and Interpolated Global Panel
Source:vignettes/ffv_gen_percent_changes_summ.Rmd
ffv_gen_percent_changes_summ.Rmd
library(tibble)
library(dplyr)
#>
#> Attaching package: 'dplyr'
#> The following objects are masked from 'package:stats':
#>
#>     filter, lag
#> The following objects are masked from 'package:base':
#>
#>     intersect, setdiff, setequal, union
library(tidyr)
library(stringr)
library(readr)
library(ggplot2)
library(kableExtra)
#>
#> Attaching package: 'kableExtra'
#> The following object is masked from 'package:dplyr':
#>
#>     group_rows

library(PrjCompPPTS)
In this vignette, we show, for each country and in the output table below, the total number of yearly data points in our global primary panel dataset, observed between 1920 and 2020. We also show the share of these data points that is based on administrative data. The remaining data points are based on interpolating and extrapolating the administrative data.
See the output table show these stats in res-tab/country_interpolate.tex.
Then we visualize the years in which we interpolate and extrapolate as well as years in which we have admin data for the selected economies in Eastern Asia and Western Europe that we consider in the paper.
spt_path_res <- file.path("..", "res-tab", fsep = .Platform$file.sep)
spn_tex_out <- file.path(spt_path_res, "country_interpolate.tex", fsep = .Platform$file.sep)
bl_tex_save <- FALSE
verbose <- TRUE
Load and select
Load in country code.
ppts_country_code <- PrjCompPPTS::ppts_country_code
ppts_country_code_sel <- ppts_country_code %>%
  filter(!is.na(location_region_group)) %>%
  arrange(
      location_region_group_code,
      location_name
    )
print(
  ppts_country_code_sel,
  n = 300
)
#> # A tibble: 218 × 7
#>     location_name      location_code location_region_group location_income_group
#>     <chr>              <chr>         <fct>                 <chr>
#>   1 Angola             AGO           Sub-Saharan Africa (… Lower middle income
#>   2 Benin              BEN           Sub-Saharan Africa (… Lower middle income
#>   3 Botswana           BWA           Sub-Saharan Africa (… Upper middle income
#>   4 Burkina Faso       BFA           Sub-Saharan Africa (… Low income
#>   5 Burundi            BDI           Sub-Saharan Africa (… Low income
#>   6 Cabo Verde         CPV           Sub-Saharan Africa (… Lower middle income
#>   7 Cameroon           CMR           Sub-Saharan Africa (… Lower middle income
#>   8 Central African R… CAF           Sub-Saharan Africa (… Low income
#>   9 Chad               TCD           Sub-Saharan Africa (… Low income
#>  10 Comoros            COM           Sub-Saharan Africa (… Lower middle income
#>  11 Congo, Dem. Rep.   COD           Sub-Saharan Africa (… Low income
#>  12 Congo, Rep.        COG           Sub-Saharan Africa (… Lower middle income
#>  13 Côte d'Ivoire      CIV           Sub-Saharan Africa (… Lower middle income
#>  14 Equatorial Guinea  GNQ           Sub-Saharan Africa (… Upper middle income
#>  15 Eritrea            ERI           Sub-Saharan Africa (… Low income
#>  16 Eswatini           SWZ           Sub-Saharan Africa (… Lower middle income
#>  17 Ethiopia           ETH           Sub-Saharan Africa (… Low income
#>  18 Gabon              GAB           Sub-Saharan Africa (… Upper middle income
#>  19 Gambia             GMB           Sub-Saharan Africa (… Low income
#>  20 Ghana              GHA           Sub-Saharan Africa (… Lower middle income
#>  21 Guinea             GIN           Sub-Saharan Africa (… Lower middle income
#>  22 Guinea-Bissau      GNB           Sub-Saharan Africa (… Low income
#>  23 Kenya              KEN           Sub-Saharan Africa (… Lower middle income
#>  24 Lesotho            LSO           Sub-Saharan Africa (… Lower middle income
#>  25 Liberia            LBR           Sub-Saharan Africa (… Low income
#>  26 Madagascar         MDG           Sub-Saharan Africa (… Low income
#>  27 Malawi             MWI           Sub-Saharan Africa (… Low income
#>  28 Mali               MLI           Sub-Saharan Africa (… Low income
#>  29 Mauritania         MRT           Sub-Saharan Africa (… Lower middle income
#>  30 Mauritius          MUS           Sub-Saharan Africa (… Upper middle income
#>  31 Mozambique         MOZ           Sub-Saharan Africa (… Low income
#>  32 Namibia            NAM           Sub-Saharan Africa (… Upper middle income
#>  33 Niger              NER           Sub-Saharan Africa (… Low income
#>  34 Nigeria            NGA           Sub-Saharan Africa (… Lower middle income
#>  35 Rwanda             RWA           Sub-Saharan Africa (… Low income
#>  36 Senegal            SEN           Sub-Saharan Africa (… Lower middle income
#>  37 Seychelles         SYC           Sub-Saharan Africa (… High income
#>  38 Sierra Leone       SLE           Sub-Saharan Africa (… Low income
#>  39 Somalia            SOM           Sub-Saharan Africa (… Low income
#>  40 South Africa       ZAF           Sub-Saharan Africa (… Upper middle income
#>  41 South Sudan        SSD           Sub-Saharan Africa (… Low income
#>  42 Sudan              SDN           Sub-Saharan Africa (… Low income
#>  43 São Tomé and Prín… STP           Sub-Saharan Africa (… Lower middle income
#>  44 Tanzania           TZA           Sub-Saharan Africa (… Lower middle income
#>  45 Togo               TGO           Sub-Saharan Africa (… Low income
#>  46 Uganda             UGA           Sub-Saharan Africa (… Low income
#>  47 Zambia             ZMB           Sub-Saharan Africa (… Lower middle income
#>  48 Zimbabwe           ZWE           Sub-Saharan Africa (… Lower middle income
#>  49 Algeria            DZA           Middle East & North … Lower middle income
#>  50 Bahrain            BHR           Middle East & North … High income
#>  51 Djibouti           DJI           Middle East & North … Lower middle income
#>  52 Egypt              EGY           Middle East & North … Lower middle income
#>  53 Iran               IRN           Middle East & North … Lower middle income
#>  54 Iraq               IRQ           Middle East & North … Upper middle income
#>  55 Israel             ISR           Middle East & North … High income
#>  56 Jordan             JOR           Middle East & North … Lower middle income
#>  57 Kuwait             KWT           Middle East & North … High income
#>  58 Lebanon            LBN           Middle East & North … Lower middle income
#>  59 Libya              LBY           Middle East & North … Upper middle income
#>  60 Malta              MLT           Middle East & North … High income
#>  61 Morocco            MAR           Middle East & North … Lower middle income
#>  62 Oman               OMN           Middle East & North … High income
#>  63 Qatar              QAT           Middle East & North … High income
#>  64 Saudi Arabia       SAU           Middle East & North … High income
#>  65 Syrian Arab Repub… SYR           Middle East & North … Low income
#>  66 Tunisia            TUN           Middle East & North … Lower middle income
#>  67 United Arab Emira… ARE           Middle East & North … High income
#>  68 West Bank and Gaza PSE           Middle East & North … Upper middle income
#>  69 Yemen              YEM           Middle East & North … Low income
#>  70 Antigua and Barbu… ATG           Latin America & Cari… High income
#>  71 Argentina          ARG           Latin America & Cari… Upper middle income
#>  72 Aruba              ABW           Latin America & Cari… High income
#>  73 Bahamas, The       BHS           Latin America & Cari… High income
#>  74 Barbados           BRB           Latin America & Cari… High income
#>  75 Belize             BLZ           Latin America & Cari… Upper middle income
#>  76 Bolivia            BOL           Latin America & Cari… Lower middle income
#>  77 Brazil             BRA           Latin America & Cari… Upper middle income
#>  78 British Virgin Is… VGB           Latin America & Cari… High income
#>  79 Cayman Islands     CYM           Latin America & Cari… High income
#>  80 Chile              CHL           Latin America & Cari… High income
#>  81 Colombia           COL           Latin America & Cari… Upper middle income
#>  82 Costa Rica         CRI           Latin America & Cari… Upper middle income
#>  83 Cuba               CUB           Latin America & Cari… Upper middle income
#>  84 Curaçao            CUW           Latin America & Cari… High income
#>  85 Dominica           DMA           Latin America & Cari… Upper middle income
#>  86 Dominican Republic DOM           Latin America & Cari… Upper middle income
#>  87 Ecuador            ECU           Latin America & Cari… Upper middle income
#>  88 El Salvador        SLV           Latin America & Cari… Upper middle income
#>  89 Grenada            GRD           Latin America & Cari… Upper middle income
#>  90 Guatemala          GTM           Latin America & Cari… Upper middle income
#>  91 Guyana             GUY           Latin America & Cari… High income
#>  92 Haiti              HTI           Latin America & Cari… Lower middle income
#>  93 Honduras           HND           Latin America & Cari… Lower middle income
#>  94 Jamaica            JAM           Latin America & Cari… Upper middle income
#>  95 Mexico             MEX           Latin America & Cari… Upper middle income
#>  96 Nicaragua          NIC           Latin America & Cari… Lower middle income
#>  97 Panama             PAN           Latin America & Cari… High income
#>  98 Paraguay           PRY           Latin America & Cari… Upper middle income
#>  99 Peru               PER           Latin America & Cari… Upper middle income
#> 100 Puerto Rico        PRI           Latin America & Cari… High income
#> 101 Sint Maarten (Dut… SXM           Latin America & Cari… High income
#> 102 St. Kitts and Nev… KNA           Latin America & Cari… High income
#> 103 St. Lucia          LCA           Latin America & Cari… Upper middle income
#> 104 St. Martin (Frenc… MAF           Latin America & Cari… High income
#> 105 St. Vincent        VCT           Latin America & Cari… Upper middle income
#> 106 Suriname           SUR           Latin America & Cari… Upper middle income
#> 107 Trinidad and Toba… TTO           Latin America & Cari… High income
#> 108 Turks and Caicos … TCA           Latin America & Cari… High income
#> 109 Uruguay            URY           Latin America & Cari… High income
#> 110 Venezuela          VEN           Latin America & Cari… NA
#> 111 Virgin Islands (U… VIR           Latin America & Cari… High income
#> 112 Bermuda            BMU           North America (NAC)   High income
#> 113 Canada             CAN           North America (NAC)   High income
#> 114 United States      USA           North America (NAC)   High income
#> 115 Afghanistan        AFG           South Asia (SAS)      Low income
#> 116 Bangladesh         BGD           South Asia (SAS)      Lower middle income
#> 117 Bhutan             BTN           South Asia (SAS)      Lower middle income
#> 118 India              IND           South Asia (SAS)      Lower middle income
#> 119 Maldives           MDV           South Asia (SAS)      Upper middle income
#> 120 Nepal              NPL           South Asia (SAS)      Lower middle income
#> 121 Pakistan           PAK           South Asia (SAS)      Lower middle income
#> 122 Sri Lanka          LKA           South Asia (SAS)      Lower middle income
#> 123 Albania            ALB           Europe & Central Asi… Upper middle income
#> 124 Andorra            AND           Europe & Central Asi… High income
#> 125 Armenia            ARM           Europe & Central Asi… Upper middle income
#> 126 Austria            AUT           Europe & Central Asi… High income
#> 127 Azerbaijan         AZE           Europe & Central Asi… Upper middle income
#> 128 Belarus            BLR           Europe & Central Asi… Upper middle income
#> 129 Belgium            BEL           Europe & Central Asi… High income
#> 130 Bosnia and Herzeg… BIH           Europe & Central Asi… Upper middle income
#> 131 Bulgaria           BGR           Europe & Central Asi… Upper middle income
#> 132 Channel Islands    CHI           Europe & Central Asi… High income
#> 133 Croatia            HRV           Europe & Central Asi… High income
#> 134 Cyprus             CYP           Europe & Central Asi… High income
#> 135 Czechia            CZE           Europe & Central Asi… High income
#> 136 Denmark            DNK           Europe & Central Asi… High income
#> 137 Estonia            EST           Europe & Central Asi… High income
#> 138 Faroe Islands      FRO           Europe & Central Asi… High income
#> 139 Finland            FIN           Europe & Central Asi… High income
#> 140 France             FRA           Europe & Central Asi… High income
#> 141 Georgia            GEO           Europe & Central Asi… Upper middle income
#> 142 Germany            DEU           Europe & Central Asi… High income
#> 143 Gibraltar          GIB           Europe & Central Asi… High income
#> 144 Greece             GRC           Europe & Central Asi… High income
#> 145 Greenland          GRL           Europe & Central Asi… High income
#> 146 Hungary            HUN           Europe & Central Asi… High income
#> 147 Iceland            ISL           Europe & Central Asi… High income
#> 148 Ireland            IRL           Europe & Central Asi… High income
#> 149 Isle of Man        IMN           Europe & Central Asi… High income
#> 150 Italy              ITA           Europe & Central Asi… High income
#> 151 Kazakhstan         KAZ           Europe & Central Asi… Upper middle income
#> 152 Kosovo             XKX           Europe & Central Asi… Upper middle income
#> 153 Kyrgyz Republic    KGZ           Europe & Central Asi… Lower middle income
#> 154 Latvia             LVA           Europe & Central Asi… High income
#> 155 Liechtenstein      LIE           Europe & Central Asi… High income
#> 156 Lithuania          LTU           Europe & Central Asi… High income
#> 157 Luxembourg         LUX           Europe & Central Asi… High income
#> 158 Moldova            MDA           Europe & Central Asi… Upper middle income
#> 159 Monaco             MCO           Europe & Central Asi… High income
#> 160 Montenegro         MNE           Europe & Central Asi… Upper middle income
#> 161 Netherlands        NLD           Europe & Central Asi… High income
#> 162 North Macedonia    MKD           Europe & Central Asi… Upper middle income
#> 163 Norway             NOR           Europe & Central Asi… High income
#> 164 Poland             POL           Europe & Central Asi… High income
#> 165 Portugal           PRT           Europe & Central Asi… High income
#> 166 Romania            ROU           Europe & Central Asi… High income
#> 167 Russian Federation RUS           Europe & Central Asi… Upper middle income
#> 168 San Marino         SMR           Europe & Central Asi… High income
#> 169 Serbia             SRB           Europe & Central Asi… Upper middle income
#> 170 Slovak Republic    SVK           Europe & Central Asi… High income
#> 171 Slovenia           SVN           Europe & Central Asi… High income
#> 172 Spain              ESP           Europe & Central Asi… High income
#> 173 Sweden             SWE           Europe & Central Asi… High income
#> 174 Switzerland        CHE           Europe & Central Asi… High income
#> 175 Tajikistan         TJK           Europe & Central Asi… Lower middle income
#> 176 Turkmenistan       TKM           Europe & Central Asi… Upper middle income
#> 177 Türkiye            TUR           Europe & Central Asi… Upper middle income
#> 178 Ukraine            UKR           Europe & Central Asi… Lower middle income
#> 179 United Kingdom     GBR           Europe & Central Asi… High income
#> 180 Uzbekistan         UZB           Europe & Central Asi… Lower middle income
#> 181 American Samoa     ASM           East Asia & Pacific … High income
#> 182 Australia          AUS           East Asia & Pacific … High income
#> 183 Brunei Darussalam  BRN           East Asia & Pacific … High income
#> 184 Cambodia           KHM           East Asia & Pacific … Lower middle income
#> 185 China              CHN           East Asia & Pacific … Upper middle income
#> 186 Fiji               FJI           East Asia & Pacific … Upper middle income
#> 187 French Polynesia   PYF           East Asia & Pacific … High income
#> 188 Guam               GUM           East Asia & Pacific … High income
#> 189 Hong Kong SAR, Ch… HKG           East Asia & Pacific … High income
#> 190 Indonesia          IDN           East Asia & Pacific … Upper middle income
#> 191 Japan              JPN           East Asia & Pacific … High income
#> 192 Kiribati           KIR           East Asia & Pacific … Lower middle income
#> 193 Korea, Dem. Peopl… PRK           East Asia & Pacific … Low income
#> 194 Korea, Rep.        KOR           East Asia & Pacific … High income
#> 195 Lao PDR            LAO           East Asia & Pacific … Lower middle income
#> 196 Macao SAR, China   MAC           East Asia & Pacific … High income
#> 197 Malaysia           MYS           East Asia & Pacific … Upper middle income
#> 198 Marshall Islands   MHL           East Asia & Pacific … Upper middle income
#> 199 Micronesia         FSM           East Asia & Pacific … Lower middle income
#> 200 Mongolia           MNG           East Asia & Pacific … Lower middle income
#> 201 Myanmar            MMR           East Asia & Pacific … Lower middle income
#> 202 Nauru              NRU           East Asia & Pacific … High income
#> 203 New Caledonia      NCL           East Asia & Pacific … High income
#> 204 New Zealand        NZL           East Asia & Pacific … High income
#> 205 Northern Mariana … MNP           East Asia & Pacific … High income
#> 206 Palau              PLW           East Asia & Pacific … Upper middle income
#> 207 Papua New Guinea   PNG           East Asia & Pacific … Lower middle income
#> 208 Philippines        PHL           East Asia & Pacific … Lower middle income
#> 209 Samoa              WSM           East Asia & Pacific … Lower middle income
#> 210 Singapore          SGP           East Asia & Pacific … High income
#> 211 Solomon Islands    SLB           East Asia & Pacific … Lower middle income
#> 212 Taiwan             TWN           East Asia & Pacific … High income
#> 213 Thailand           THA           East Asia & Pacific … Upper middle income
#> 214 Timor-Leste        TLS           East Asia & Pacific … Lower middle income
#> 215 Tonga              TON           East Asia & Pacific … Upper middle income
#> 216 Tuvalu             TUV           East Asia & Pacific … Upper middle income
#> 217 Vanuatu            VUT           East Asia & Pacific … Lower middle income
#> 218 Vietnam            VNM           East Asia & Pacific … Lower middle income
#> # ℹ 3 more variables: location_wblend_group <chr>,
#> #   location_region_group_code <chr>, location_code_adj <chr>
Load in the dataset generated by articles/ffv_gen_percent_changes.
ppts_easia_weuro_world_pchg <- PrjCompPPTS::ppts_easia_weuro_world_pchg
ppts_easia_weuro_world_pchg %>% distinct(year_bins_type)
#> # A tibble: 5 × 1
#>   year_bins_type
#>   <fct>
#> 1 1920t2020i05
#> 2 1920t2020i10
#> 3 1920t2020i20
#> 4 1925t2015i15
#> 5 1940t2020i01
ppts_easia_weuro_world_pchg %>% distinct(variable)
#> # A tibble: 5 × 1
#>   variable
#>   <fct>
#> 1 gdp
#> 2 student
#> 3 teacher
#> 4 youthpop
#> 5 school
ppts_pchg <- ppts_easia_weuro_world_pchg %>%
  filter(
    year_bins_type == "1940t2020i01",
    variable %in% c("youthpop", "student", "teacher", "school")
    ) %>%
  select(
    location_code,
    location_level,location_code, variable,
    year_bins,
    pchg, pchg_interp1, value, value_interp1
  )
Annual year variable as numeric and sort.
Compare interpolated and raw data by countries and decades
First, from data/ppts_easia_weuro_world_pchg.rda,
generate year groups. We generate three year groupings, one is based on
all years, one is based on each decade.
# Get all years
ar_year <- ppts_pchg %>%
  distinct(year) %>% pull(year)

# Min and max years
fl_it_year_min <- min(ar_year)
fl_it_year_max <- max(ar_year)

# collect
ls_ar_years_cates <- vector(mode = "list", length = 3)
ls_st_years_cates_labels <- vector(mode = "list", length = 3)

# Year groups for summarizing, all years jointly
ar_it_year_cates <- c(1920, 2021)
ar_st_year_cates_labels <- c("1920 to 2020")
ls_ar_years_cates[[1]] <- ar_it_year_cates
ls_st_years_cates_labels[[1]] <- ar_st_year_cates_labels

# Year groups for summarizing, per two decade groupings
it_year_groups <- 6
ar_it_year_cates <- seq(1920, 2020, length.out=it_year_groups)
ar_it_year_cates[6] <- 2021
ar_st_year_cates_labels <- paste0(ar_it_year_cates[1:(it_year_groups-2)], " to ", ar_it_year_cates[2:(it_year_groups-1)] - 1)
ar_st_year_cates_labels <- c(ar_st_year_cates_labels, "2000 to 2020")
ls_ar_years_cates[[2]] <- ar_it_year_cates
ls_st_years_cates_labels[[2]] <- ar_st_year_cates_labels

# Year groups for summarizing, per decade groupings
it_year_groups <- 11
ar_it_year_cates <- seq(1920, 2020, length.out=it_year_groups)
ar_it_year_cates[11] <- 2021
ar_st_year_cates_labels <- paste0(ar_it_year_cates[1:(it_year_groups-2)], " to ", ar_it_year_cates[2:(it_year_groups-1)] - 1)
ar_st_year_cates_labels <- c(ar_st_year_cates_labels, "2010 to 2020")
ls_ar_years_cates[[3]] <- ar_it_year_cates
ls_st_years_cates_labels[[3]] <- ar_st_year_cates_labels
Second, generate year groupings.
# year groups for summarizing
ppts_pchg_longer <- ppts_pchg %>%
  mutate(
    year_group_1 = base::cut(year,
        breaks = ls_ar_years_cates[[1]],
        labels = ls_st_years_cates_labels[[1]],
        right = FALSE
      ),
    year_group_2 = base::cut(year,
        breaks = ls_ar_years_cates[[2]],
        labels = ls_st_years_cates_labels[[2]],
        right = FALSE
      ),
    year_group_3 = base::cut(year,
        breaks = ls_ar_years_cates[[3]],
        labels = ls_st_years_cates_labels[[3]],
        right = FALSE
      )
  ) %>%
  pivot_longer(cols = starts_with('year_group'),
              names_to = c('year_group_set'),
              names_pattern = paste0("year_group_(.*)"),
              values_to = "year_group")
Third, group by country, variable, decade and count data observations, do this for both interp or not.
# year groups for summarizing
ppts_pchg_grp <- ppts_pchg_longer %>%
  group_by(
    location_code, variable, year_group_set, year_group,
    ) %>%
  summarize(
    pchg_itp_cnt = sum(!is.na(value_interp1)),
    pchg_raw_cnt = sum(!is.na(value)),
    pchg_raw_shr = pchg_raw_cnt/pchg_itp_cnt,
  )
#> `summarise()` has grouped output by 'location_code', 'variable',
#> 'year_group_set'. You can override using the `.groups` argument.
# ppts_pchg_grp %>% filter(location_code == "TWN", variable == "school", year_group_set == 1)
# print(ppts_pchg_longer %>% filter(location_code == "TWN", variable == "school", year_group_set == 1), n = 100)
Fourth, reshape variables from long to wide for four key variables.
# year groups for summarizing
ppts_pchg_grp_wider <- ppts_pchg_grp %>%
  pivot_wider(id_cols = c(
      "location_code",
      "year_group_set",
      "year_group"
    ),
    names_from = "variable",
    names_prefix = "",
    values_from = c(
      pchg_itp_cnt, pchg_raw_shr
    ))
Fifth, use table-maker to generate a table, highlighting share of data from each country interpolated/extrapolated.
ppts_pchg_grp_tab <- ppts_pchg_grp_wider %>%
  left_join(ppts_country_code_sel, by = "location_code") %>%
  arrange(
   location_region_group_code, location_name,
  ) %>%
  filter(
    !is.na(location_name)
  ) %>%
  filter(
    year_group_set == 1
    ) %>%
  select(
    location_region_group,
    location_region_group_code,
    location_code,
    location_name,
    year_group_set,
    year_group,
    pchg_itp_cnt_youthpop,
    pchg_raw_shr_youthpop,
    pchg_itp_cnt_student,
    pchg_raw_shr_student,
    pchg_itp_cnt_teacher,
    pchg_raw_shr_teacher,
    pchg_itp_cnt_school,
    pchg_raw_shr_school
  )
Generate table and statistics
Sort and generate group counts.
# Sorted file
df_data_sorted <- ppts_pchg_grp_tab %>%
  rename(
    group_sorter_desc = location_region_group,
    group_sorter = location_region_group_code,
    country_name = location_name
  ) %>%
  arrange(
    group_sorter, location_code,
  ) %>%
  group_by(group_sorter) %>%
  ungroup()
# Count by group
df_group_counts <- df_data_sorted %>%
  group_by(group_sorter_desc, group_sorter) %>%
  summarize(group_count = n()) %>%
  arrange(group_sorter) %>% ungroup() %>%
  mutate(group_count_start = cumsum(group_count) - group_count + 1) %>%
  mutate(group_count_end = cumsum(group_count)) %>%
  select(group_count_start, group_count_end, everything())
#> `summarise()` has grouped output by 'group_sorter_desc'. You can override using
#> the `.groups` argument.
# display
kable(df_group_counts, caption="Group counter")| group_count_start | group_count_end | group_sorter_desc | group_sorter | group_count |
|---|---|---|---|---|
| 1 | 48 | Sub-Saharan Africa (SSF) | 1SSF | 48 |
| 49 | 69 | Middle East & North Africa (MEA) | 2MEA | 21 |
| 70 | 110 | Latin America & Caribbean (LCN) | 3LCN | 41 |
| 111 | 113 | North America (NAC) | 4NAC | 3 |
| 114 | 121 | South Asia (SAS) | 5SAS | 8 |
| 122 | 176 | Europe & Central Asia (ECS) | 6ECS | 55 |
| 177 | 213 | East Asia & Pacific (EAS) | 7EAS | 37 |
Format columns, decimals, percentage signs, etc.
# 4. Format columns, decimals, percentage signs, etc
df_data_formatted <- df_data_sorted %>%
  arrange(group_sorter, country_name) %>%
  select(
      country_name,
      pchg_itp_cnt_youthpop, pchg_raw_shr_youthpop,
      pchg_itp_cnt_student, pchg_raw_shr_student,
      pchg_itp_cnt_teacher, pchg_raw_shr_teacher,
      pchg_itp_cnt_school, pchg_raw_shr_school
    ) %>%
  mutate_at(
    vars(contains("shr")),
    list(~ paste0(
      format(round(., 2) * 100,
        nsmall = 0,
        big.mark = ","
      ),
      "%"
    ))
  ) %>%
  mutate_at(
    vars(contains("cnt")),
    list(~ paste0(.))
  )
df_data_formatted <- df_data_formatted %>%
  mutate_at(vars(contains("shr")), ~ str_replace(., "NA%", "")) %>%
  mutate_at(vars(contains("cnt")), ~ str_replace(., "NA", ""))
Generate table. Also see res-tab/country_interpolate.tex.
ar_st_kableformat <- c("html", "latex")
ar_st_kableformat <- c("html")
for (st_kableformat in ar_st_kableformat) {
  # Column names
  ar_st_col_names <- c(
    "Country name",
    "Obs yrs",
    "Perc. of yrs with admin data",
    "Obs yrs",
    "Perc. of yrs with admin data",
    "Obs yrs",
    "Perc. of yrs with admin data",
    "Obs yrs",
    "Perc. of yrs with admin data"
  )
  # Define column groups, grouping the names above
  # =1/3/2 are number of columns group title covers
  ar_st_col_groups1 <- c(
    " " = 1,
    "Youth population" = 2,
    "Students" = 2,
    "Teachers" = 2,
    "Schools" = 2
  )
  # Second, we construct main table, and add styling.
  st_title <- paste(
    "Share of country-specific data generated through interpolation and extrapolation"
    )
  bk_tab_a <- kbl(
    df_data_formatted,
    format = st_kableformat,
    label = "tab:lac:aod:temp:rank",
    # escape = F,
    linesep = "",
    booktabs = T,
    longtable = T,
    align = "c",
    caption = st_title,
    col.names = ar_st_col_names
  ) %>%
    # see https://cran.r-project.org/web/packages/kableExtra/vignettes/awesome_table_in_html.html#Bootstrap_table_classes
    kable_styling(
      bootstrap_options = c("striped", "hover", "condensed", "responsive"),
      full_width = F, position = "left"
    )
  # Third, we add in column groups.
  bk_tab_a <- bk_tab_a %>%
    add_header_above(ar_st_col_groups1)
  # Fourth, we add in row groups.
  for (it_group in seq(1, dim(df_group_counts)[1])) {
    # Reion full name info
    st_loc <- as.character(df_group_counts[[it_group, "group_sorter_desc"]])
    # groups start and end
    it_group_count_start <- df_group_counts[[it_group, "group_count_start"]]
    it_group_count_end <- df_group_counts[[it_group, "group_count_end"]]
    # display text
    st_panel_letter <- base::LETTERS[it_group]
    # Heading group row, year
    st_panel_text <- paste0(
      "Panel ", st_panel_letter, ": ", st_loc
    )
    # Add to table
    bk_tab_a <- bk_tab_a %>%
      pack_rows(
        st_panel_text, it_group_count_start, it_group_count_end,
        latex_gap_space = "0.25em",
        latex_align = "c",
        hline_after = TRUE
      )
  }
  # Fifth, column formatting.
  fl_width_country <- 6
  st_width_country <- paste0(fl_width_country, "cm")
  bk_tab_a <- bk_tab_a %>%
    column_spec(1, width = st_width_country) %>%
    column_spec(2:dim(df_data_formatted)[2], width = "3cm")
  # Final adjustments
  # Headings on all pages, note use `sub` to replace first midrule
  st_headend <- paste0(
    "\\midrule\\endhead\n",
    "\\addlinespace[0.2em]\\hline\\addlinespace[0.2em]\n",
    "\\multicolumn{", dim(df_data_formatted)[2], "}{r}{\\emph{Continued on next page}}\\\\\n",
    "\\endfoot\\endlastfoot"
  )
  bk_tab_a <- sub(bk_tab_a,
    pattern = "\\midrule", replacement = st_headend,
    fixed = TRUE
  )

  # country-names left-align
  bk_tab_a <- gsub(bk_tab_a,
    pattern = paste0("\\centering\\arraybackslash}p{", st_width_country, "}"),
    replacement = paste0("\\raggedright\\arraybackslash}p{", st_width_country, "}"),
    fixed = TRUE
  )
  bk_tab_a <- gsub(bk_tab_a,
    pattern = paste0("\\$\\textasciicircum{}\\{\\textbackslash{}circ\\}C\\$"),
    replacement = paste0("$^{\\circ}C$"),
    fixed = TRUE
  )
  bk_tab_a <- gsub(bk_tab_a,
    pattern = paste0("\\$\\textbackslash{}ge\\$"),
    replacement = paste0("$\\ge$"),
    fixed = TRUE
  )
  st_text <- ""
  bk_tab_a <- gsub(bk_tab_a,
    pattern = paste0("\\textbackslash{}", st_text, "\\"),
    replacement = paste0("\\", st_text),
    fixed = TRUE
  )
  # midrule replacing hline
  bk_tab_a <- gsub(bk_tab_a,
    pattern = "hline",
    replacement = "midrule", fixed = TRUE
  )

  # 6. Finally, save table content to file
  if (st_kableformat == "latex") {
    if (bl_tex_save) {
      fileConn <- file(spn_tex_out)
      writeLines(bk_tab_a, fileConn)
      close(fileConn)
      if (verbose) {
        print(glue::glue("F-815346, S3"))
        print(glue::glue("Latex saved: {spn_tex_out}"))
      }
    }
  } else if (st_kableformat == "html") {
    bk_tab_a_html <- bk_tab_a
  }
}
#> Warning in pack_rows(., st_panel_text, it_group_count_start, it_group_count_end, : latex_align parameter is not used in HTML Mode,
#>                                     use label_row_css instead.
#> Warning in pack_rows(., st_panel_text, it_group_count_start, it_group_count_end, : latex_align parameter is not used in HTML Mode,
#>                                     use label_row_css instead.
#> Warning in pack_rows(., st_panel_text, it_group_count_start, it_group_count_end, : latex_align parameter is not used in HTML Mode,
#>                                     use label_row_css instead.
#> Warning in pack_rows(., st_panel_text, it_group_count_start, it_group_count_end, : latex_align parameter is not used in HTML Mode,
#>                                     use label_row_css instead.
#> Warning in pack_rows(., st_panel_text, it_group_count_start, it_group_count_end, : latex_align parameter is not used in HTML Mode,
#>                                     use label_row_css instead.
#> Warning in pack_rows(., st_panel_text, it_group_count_start, it_group_count_end, : latex_align parameter is not used in HTML Mode,
#>                                     use label_row_css instead.
#> Warning in pack_rows(., st_panel_text, it_group_count_start, it_group_count_end, : latex_align parameter is not used in HTML Mode,
#>                                     use label_row_css instead.
bk_tab_a_html| Country name | Obs yrs | Perc. of yrs with admin data | Obs yrs | Perc. of yrs with admin data | Obs yrs | Perc. of yrs with admin data | Obs yrs | Perc. of yrs with admin data |
|---|---|---|---|---|---|---|---|---|
| Panel A: Sub-Saharan Africa (SSF) | ||||||||
| Angola | 61 | 100% | 55 | 44% | 55 | 36% | ||
| Benin | 61 | 100% | 55 | 89% | 55 | 89% | ||
| Botswana | 61 | 100% | 56 | 79% | 56 | 77% | ||
| Burkina Faso | 61 | 100% | 55 | 89% | 55 | 89% | ||
| Burundi | 61 | 100% | 55 | 87% | 55 | 82% | ||
| Cabo Verde | 61 | 100% | 55 | 80% | 55 | 73% | ||
| Cameroon | 61 | 100% | 55 | 85% | 55 | 80% | ||
| Central African Republic | 61 | 100% | 55 | 64% | 55 | 49% | ||
| Chad | 61 | 100% | 55 | 76% | 55 | 62% | ||
| Comoros | 61 | 100% | 55 | 64% | 55 | 53% | ||
| Congo, Dem. Rep. | 61 | 100% | 55 | 67% | 55 | 40% | ||
| Congo, Rep. | 61 | 100% | 55 | 78% | 55 | 75% | ||
| Côte d’Ivoire | 61 | 100% | 56 | 86% | 56 | 84% | ||
| Equatorial Guinea | 61 | 100% | 55 | 36% | 52 | 31% | ||
| Eritrea | 57 | 91% | 37 | 76% | 37 | 78% | ||
| Eswatini | 61 | 100% | 56 | 88% | 56 | 88% | ||
| Ethiopia | 61 | 100% | 55 | 82% | 55 | 62% | ||
| Gabon | 61 | 100% | 51 | 57% | 51 | 55% | ||
| Gambia | 61 | 100% | 55 | 91% | 55 | 84% | ||
| Ghana | 61 | 100% | 55 | 87% | 52 | 88% | ||
| Guinea | 61 | 100% | 55 | 84% | 55 | 85% | ||
| Guinea-Bissau | 61 | 100% | 50 | 60% | 50 | 30% | ||
| Kenya | 61 | 100% | 56 | 75% | 28 | 54% | ||
| Lesotho | 61 | 100% | 56 | 86% | 56 | 84% | ||
| Liberia | 61 | 100% | 56 | 36% | 28 | 39% | ||
| Madagascar | 61 | 100% | 55 | 82% | 55 | 84% | ||
| Malawi | 61 | 100% | 55 | 85% | 27 | 44% | ||
| Mali | 61 | 100% | 55 | 87% | 55 | 85% | ||
| Mauritania | 61 | 100% | 55 | 89% | 55 | 85% | ||
| Mauritius | 61 | 100% | 56 | 89% | 56 | 89% | ||
| Mozambique | 61 | 100% | 55 | 80% | 55 | 78% | ||
| Namibia | 61 | 100% | 40 | 72% | 34 | 53% | ||
| Niger | 61 | 100% | 55 | 87% | 55 | 85% | ||
| Nigeria | 61 | 100% | 56 | 77% | 56 | 64% | ||
| Rwanda | 61 | 100% | 55 | 82% | 55 | 82% | ||
| Senegal | 61 | 100% | 55 | 85% | 55 | 85% | ||
| Seychelles | 61 | 100% | 56 | 89% | 56 | 66% | ||
| Sierra Leone | 61 | 100% | 55 | 55% | 55 | 49% | ||
| Somalia | 61 | 100% | 47 | 34% | 47 | 21% | ||
| South Africa | 61 | 100% | 56 | 68% | 49 | 49% | ||
| South Sudan | 61 | 100% | 15 | 13% | 15 | 13% | ||
| Sudan | 61 | 100% | 25 | 72% | ||||
| São Tomé and Príncipe | 61 | 100% | 55 | 67% | 55 | 47% | ||
| Tanzania | 61 | 100% | 56 | 91% | 56 | 84% | ||
| Togo | 61 | 100% | 55 | 89% | 55 | 89% | ||
| Uganda | 61 | 100% | 56 | 84% | 56 | 86% | ||
| Zambia | 61 | 100% | 56 | 79% | 56 | 73% | ||
| Zimbabwe | 61 | 100% | 56 | 73% | 53 | 72% | ||
| Panel B: Middle East & North Africa (MEA) | ||||||||
| Algeria | 61 | 100% | 55 | 91% | 55 | 84% | ||
| Bahrain | 61 | 100% | 55 | 82% | 53 | 62% | ||
| Djibouti | 61 | 100% | 55 | 89% | 55 | 73% | ||
| Egypt | 61 | 100% | 55 | 84% | 55 | 65% | ||
| Iran | 61 | 100% | 55 | 85% | 55 | 73% | ||
| Iraq | 61 | 100% | 47 | 60% | 47 | 60% | ||
| Israel | 61 | 100% | 53 | 85% | 51 | 76% | ||
| Jordan | 61 | 100% | 55 | 84% | 55 | 55% | ||
| Kuwait | 61 | 95% | 55 | 91% | 55 | 91% | ||
| Lebanon | 61 | 100% | 55 | 71% | 45 | 49% | ||
| Libya | 61 | 100% | 46 | 43% | 23 | 52% | ||
| Malta | 61 | 100% | 55 | 89% | 55 | 80% | ||
| Morocco | 61 | 100% | 55 | 91% | 55 | 84% | ||
| Oman | 61 | 100% | 55 | 87% | 55 | 65% | ||
| Qatar | 61 | 100% | 55 | 91% | 55 | 85% | ||
| Saudi Arabia | 61 | 100% | 47 | 34% | 47 | 34% | ||
| Syrian Arab Republic | 61 | 100% | 53 | 81% | 42 | 76% | ||
| Tunisia | 61 | 100% | 55 | 89% | 55 | 85% | ||
| United Arab Emirates | 61 | 100% | 55 | 87% | 55 | 85% | ||
| West Bank and Gaza | 36 | 86% | 31 | 81% | 27 | 81% | ||
| Yemen | 61 | 100% | 27 | 44% | 27 | 19% | ||
| Panel C: Latin America & Caribbean (LCN) | ||||||||
| Antigua and Barbuda | 61 | 100% | 55 | 40% | 54 | 33% | ||
| Argentina | 61 | 100% | 56 | 80% | 49 | 61% | ||
| Aruba | 61 | 100% | 26 | 62% | 24 | 58% | ||
| Bahamas, The | 61 | 100% | 55 | 75% | 55 | 55% | ||
| Barbados | 61 | 100% | 55 | 69% | 48 | 56% | ||
| Belize | 61 | 100% | 55 | 85% | 27 | 78% | ||
| Bolivia | 61 | 100% | 56 | 84% | 27 | 26% | ||
| Brazil | 61 | 100% | 56 | 80% | 56 | 38% | ||
| British Virgin Islands | 55 | 69% | 55 | 60% | ||||
| Cayman Islands | 54 | 44% | 49 | 33% | ||||
| Chile | 61 | 100% | 56 | 82% | 28 | 75% | ||
| Colombia | 61 | 100% | 56 | 86% | 56 | 84% | ||
| Costa Rica | 61 | 100% | 56 | 89% | 56 | 84% | ||
| Cuba | 61 | 100% | 55 | 91% | 55 | 89% | ||
| Curaçao | 61 | 100% | 13 | 15% | ||||
| Dominica | 55 | 76% | 53 | 49% | ||||
| Dominican Republic | 61 | 100% | 55 | 82% | 55 | 53% | ||
| Ecuador | 61 | 100% | 55 | 91% | 55 | 89% | ||
| El Salvador | 61 | 100% | 56 | 82% | 23 | 52% | ||
| Grenada | 61 | 100% | 55 | 80% | 55 | 71% | ||
| Guatemala | 61 | 100% | 56 | 88% | 56 | 82% | ||
| Guyana | 61 | 100% | 52 | 69% | 52 | 58% | ||
| Haiti | 61 | 100% | 38 | 63% | 38 | 63% | ||
| Honduras | 61 | 100% | 56 | 82% | 56 | 66% | ||
| Jamaica | 61 | 100% | 55 | 78% | 55 | 49% | ||
| Mexico | 61 | 100% | 55 | 89% | 55 | 84% | ||
| Nicaragua | 61 | 100% | 51 | 76% | 51 | 76% | ||
| Panama | 61 | 100% | 56 | 84% | 56 | 70% | ||
| Paraguay | 61 | 100% | 56 | 80% | 53 | 58% | ||
| Peru | 61 | 100% | 56 | 91% | 56 | 91% | ||
| Puerto Rico | 61 | 100% | 55 | 31% | 51 | 24% | ||
| Sint Maarten (Dutch part) | 13 | 15% | 1 | 100% | ||||
| St. Kitts and Nevis | 50 | 72% | 46 | 63% | ||||
| St. Lucia | 61 | 100% | 55 | 91% | 54 | 91% | ||
| St. Vincent | 61 | 100% | 55 | 56% | 54 | 44% | ||
| Suriname | 61 | 100% | 55 | 76% | 55 | 73% | ||
| Trinidad and Tobago | 61 | 100% | 50 | 78% | 49 | 71% | ||
| Turks and Caicos Islands | 55 | 38% | 55 | 24% | ||||
| Uruguay | 61 | 100% | 56 | 89% | 56 | 84% | ||
| Venezuela | 61 | 100% | 55 | 80% | 27 | 63% | ||
| Virgin Islands (U.S.) | 61 | 100% | 33 | 52% | 33 | 27% | ||
| Panel D: North America (NAC) | ||||||||
| Bermuda | 55 | 53% | 55 | 53% | ||||
| Canada | 61 | 100% | 55 | 82% | 28 | 61% | ||
| United States | 61 | 100% | 12 | 50% | 42 | 29% | ||
| Panel E: South Asia (SAS) | ||||||||
| Afghanistan | 61 | 100% | 56 | 79% | 56 | 46% | ||
| Bangladesh | 61 | 100% | 56 | 54% | 56 | 55% | ||
| Bhutan | 61 | 100% | 56 | 82% | 56 | 59% | ||
| India | 61 | 100% | 55 | 84% | 55 | 35% | ||
| Maldives | 61 | 100% | 46 | 67% | 28 | 79% | ||
| Nepal | 61 | 100% | 56 | 84% | 56 | 84% | ||
| Pakistan | 61 | 100% | 55 | 73% | 55 | 73% | ||
| Sri Lanka | 61 | 100% | 56 | 84% | 50 | 54% | ||
| Panel F: Europe & Central Asia (ECS) | ||||||||
| Albania | 61 | 100% | 50 | 88% | 29 | 59% | ||
| Andorra | 51 | 41% | 51 | 41% | ||||
| Armenia | 61 | 100% | 35 | 86% | 35 | 46% | ||
| Austria | 66 | 92% | 98 | 78% | 98 | 78% | 98 | 78% |
| Azerbaijan | 61 | 100% | 45 | 76% | 35 | 86% | ||
| Belarus | 61 | 100% | 55 | 87% | 34 | 74% | ||
| Belgium | 61 | 100% | 55 | 85% | 55 | 49% | ||
| Bosnia and Herzegovina | 61 | 100% | 19 | 74% | 13 | 62% | ||
| Bulgaria | 61 | 100% | 55 | 89% | 30 | 77% | ||
| Channel Islands | 61 | 100% | ||||||
| Croatia | 61 | 100% | 33 | 79% | 30 | 73% | ||
| Cyprus | 61 | 100% | 55 | 87% | 55 | 87% | ||
| Czechia | 61 | 100% | 55 | 87% | 53 | 77% | ||
| Denmark | 61 | 100% | 55 | 85% | 41 | 41% | ||
| Estonia | 61 | 100% | 45 | 87% | 32 | 50% | ||
| Faroe Islands | 1 | 100% | ||||||
| Finland | 61 | 100% | 55 | 89% | 55 | 67% | ||
| France | 41 | 100% | 41 | 88% | 41 | 93% | 41 | 93% |
| Georgia | 61 | 100% | 45 | 71% | 45 | 56% | ||
| Germany | 34 | 85% | 28 | 82% | 34 | 85% | 34 | 85% |
| Gibraltar | 55 | 45% | 54 | 43% | ||||
| Greece | 61 | 100% | 55 | 85% | 55 | 82% | ||
| Hungary | 61 | 100% | 55 | 89% | 32 | 72% | ||
| Iceland | 61 | 100% | 55 | 89% | 55 | 24% | ||
| Ireland | 61 | 100% | 55 | 89% | 48 | 77% | ||
| Italy | 61 | 100% | 55 | 89% | 55 | 78% | ||
| Kazakhstan | 61 | 100% | 45 | 76% | 40 | 78% | ||
| Kyrgyz Republic | 61 | 100% | 45 | 76% | 45 | 58% | ||
| Latvia | 61 | 100% | 45 | 87% | 45 | 87% | ||
| Liechtenstein | 23 | 70% | 23 | 74% | ||||
| Lithuania | 61 | 100% | 45 | 73% | 45 | 73% | ||
| Luxembourg | 61 | 100% | 56 | 79% | 56 | 66% | ||
| Moldova | 61 | 100% | 45 | 73% | 45 | 73% | ||
| Monaco | 55 | 51% | 54 | 20% | ||||
| Montenegro | 61 | 100% | 23 | 70% | ||||
| Netherlands | 36 | 86% | 36 | 86% | 23 | 65% | 36 | 86% |
| North Macedonia | 61 | 100% | 33 | 73% | 28 | 75% | ||
| Norway | 61 | 100% | 55 | 89% | 55 | 18% | ||
| Poland | 61 | 100% | 55 | 85% | 25 | 68% | ||
| Portugal | 61 | 100% | 55 | 85% | 53 | 75% | ||
| Romania | 61 | 100% | 55 | 67% | 45 | 76% | ||
| Russian Federation | 61 | 100% | 55 | 85% | 45 | 56% | ||
| San Marino | 55 | 65% | 55 | 65% | ||||
| Serbia | 61 | 100% | 27 | 81% | 19 | 74% | ||
| Slovak Republic | 61 | 100% | 35 | 83% | 33 | 76% | ||
| Slovenia | 61 | 100% | 45 | 87% | 33 | 67% | ||
| Spain | 61 | 100% | 55 | 89% | 55 | 67% | ||
| Sweden | 61 | 100% | 55 | 89% | 55 | 60% | ||
| Switzerland | 65 | 40% | 101 | 35% | 101 | 21% | 16 | 69% |
| Tajikistan | 61 | 100% | 35 | 77% | 35 | 77% | ||
| Turkmenistan | 61 | 100% | 7 | 29% | 7 | 29% | ||
| Türkiye | 61 | 100% | 55 | 84% | 55 | 56% | ||
| Ukraine | 61 | 100% | 55 | 82% | 35 | 74% | ||
| United Kingdom | 61 | 100% | 55 | 80% | 55 | 73% | ||
| Uzbekistan | 61 | 100% | 45 | 76% | 45 | 76% | ||
| Panel G: East Asia & Pacific (EAS) | ||||||||
| American Samoa | 32 | 59% | 32 | 47% | ||||
| Australia | 61 | 100% | 55 | 89% | 39 | 59% | ||
| Brunei Darussalam | 61 | 100% | 56 | 89% | 56 | 84% | ||
| Cambodia | 61 | 100% | 55 | 73% | 55 | 71% | ||
| China | 66 | 92% | 72 | 100% | 72 | 100% | 72 | 100% |
| Fiji | 61 | 100% | 56 | 71% | 45 | 36% | ||
| French Polynesia | 61 | 100% | 36 | 67% | 36 | 61% | ||
| Guam | 61 | 100% | 29 | 62% | 29 | 55% | ||
| Hong Kong SAR, China | 61 | 100% | 55 | 89% | 55 | 85% | ||
| Indonesia | 61 | 100% | 56 | 84% | 56 | 84% | ||
| Japan | 66 | 92% | 73 | 100% | 73 | 100% | 73 | 100% |
| Kiribati | 61 | 100% | 55 | 78% | 54 | 74% | ||
| Korea, Dem. People’s Rep. | 61 | 100% | 17 | 12% | 17 | 12% | ||
| Korea, Rep. | 56 | 100% | 56 | 100% | 56 | 100% | 56 | 100% |
| Lao PDR | 61 | 100% | 55 | 84% | 55 | 84% | ||
| Macao SAR, China | 61 | 100% | 55 | 65% | 55 | 55% | ||
| Malaysia | 61 | 100% | 56 | 77% | 56 | 77% | ||
| Marshall Islands | 27 | 52% | 14 | 14% | ||||
| Micronesia | 61 | 100% | 55 | 31% | 55 | 9% | ||
| Mongolia | 61 | 100% | 55 | 87% | 55 | 73% | ||
| Myanmar | 61 | 100% | 55 | 76% | 55 | 73% | ||
| Nauru | 55 | 36% | 55 | 29% | ||||
| New Caledonia | 61 | 100% | 35 | 71% | 32 | 66% | ||
| New Zealand | 61 | 100% | 56 | 89% | 55 | 75% | ||
| Palau | 27 | 37% | 12 | 17% | ||||
| Papua New Guinea | 61 | 100% | 56 | 68% | 56 | 45% | ||
| Philippines | 61 | 100% | 55 | 82% | 55 | 80% | ||
| Samoa | 61 | 100% | 56 | 70% | 51 | 45% | ||
| Singapore | 61 | 100% | 56 | 61% | 56 | 61% | ||
| Solomon Islands | 61 | 100% | 56 | 75% | 56 | 61% | ||
| Taiwan | 46 | 100% | 46 | 100% | 46 | 100% | 46 | 100% |
| Thailand | 61 | 100% | 55 | 89% | 55 | 64% | ||
| Timor-Leste | 61 | 100% | 25 | 68% | 25 | 40% | ||
| Tonga | 61 | 100% | 56 | 84% | 56 | 82% | ||
| Tuvalu | 42 | 50% | 32 | 34% | ||||
| Vanuatu | 61 | 100% | 56 | 73% | 56 | 46% | ||
| Vietnam | 61 | 100% | 50 | 88% | 50 | 84% | ||
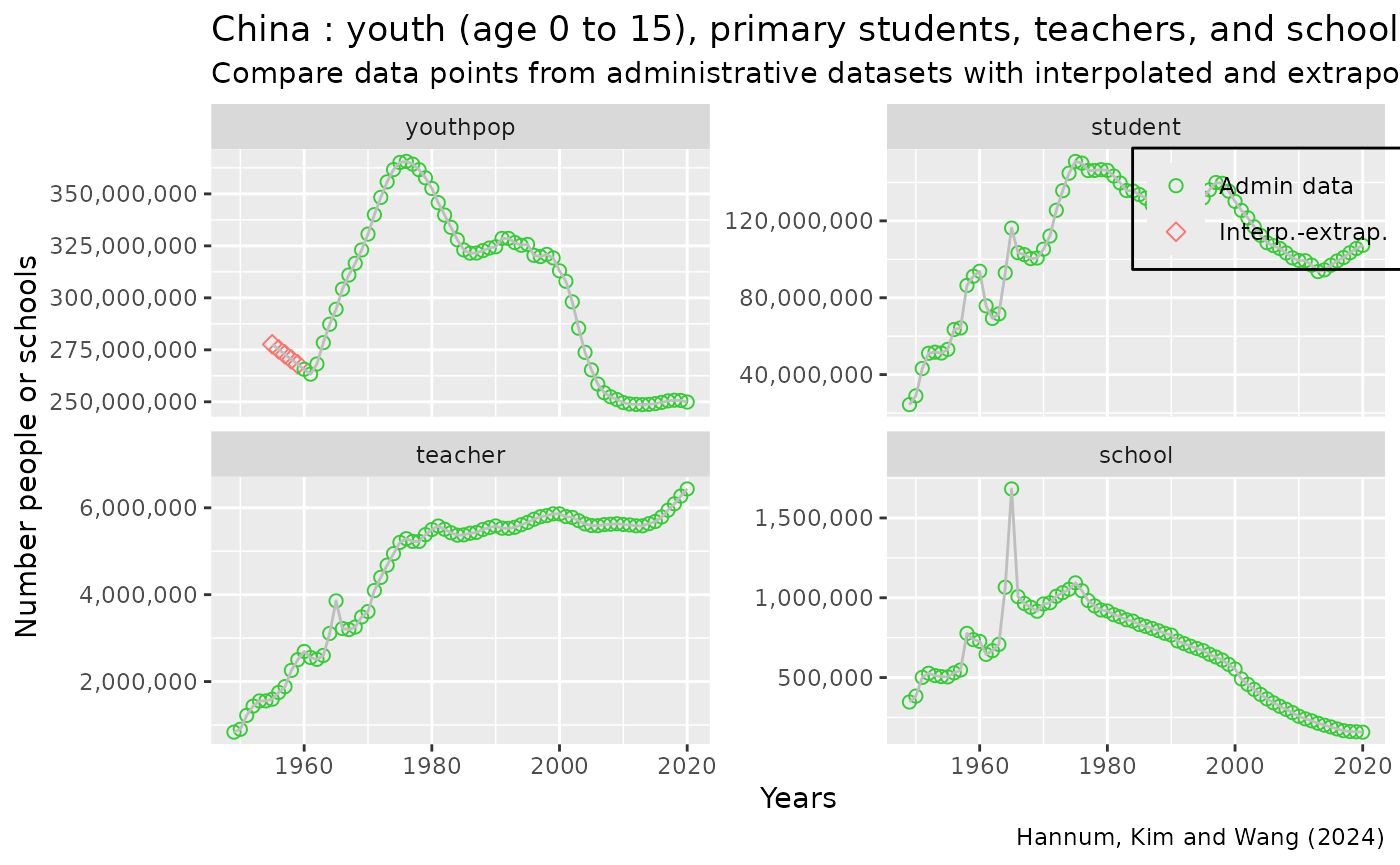
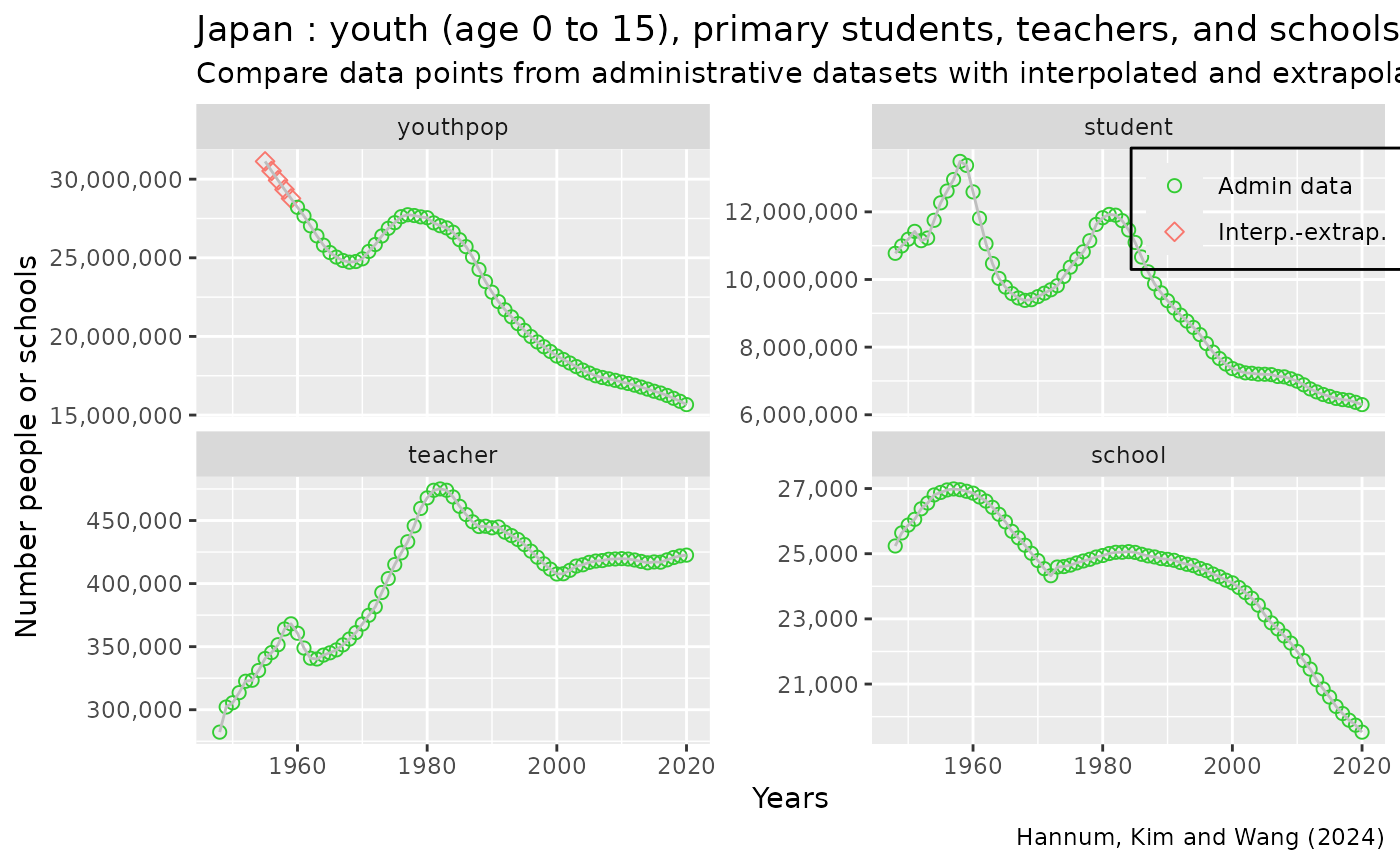
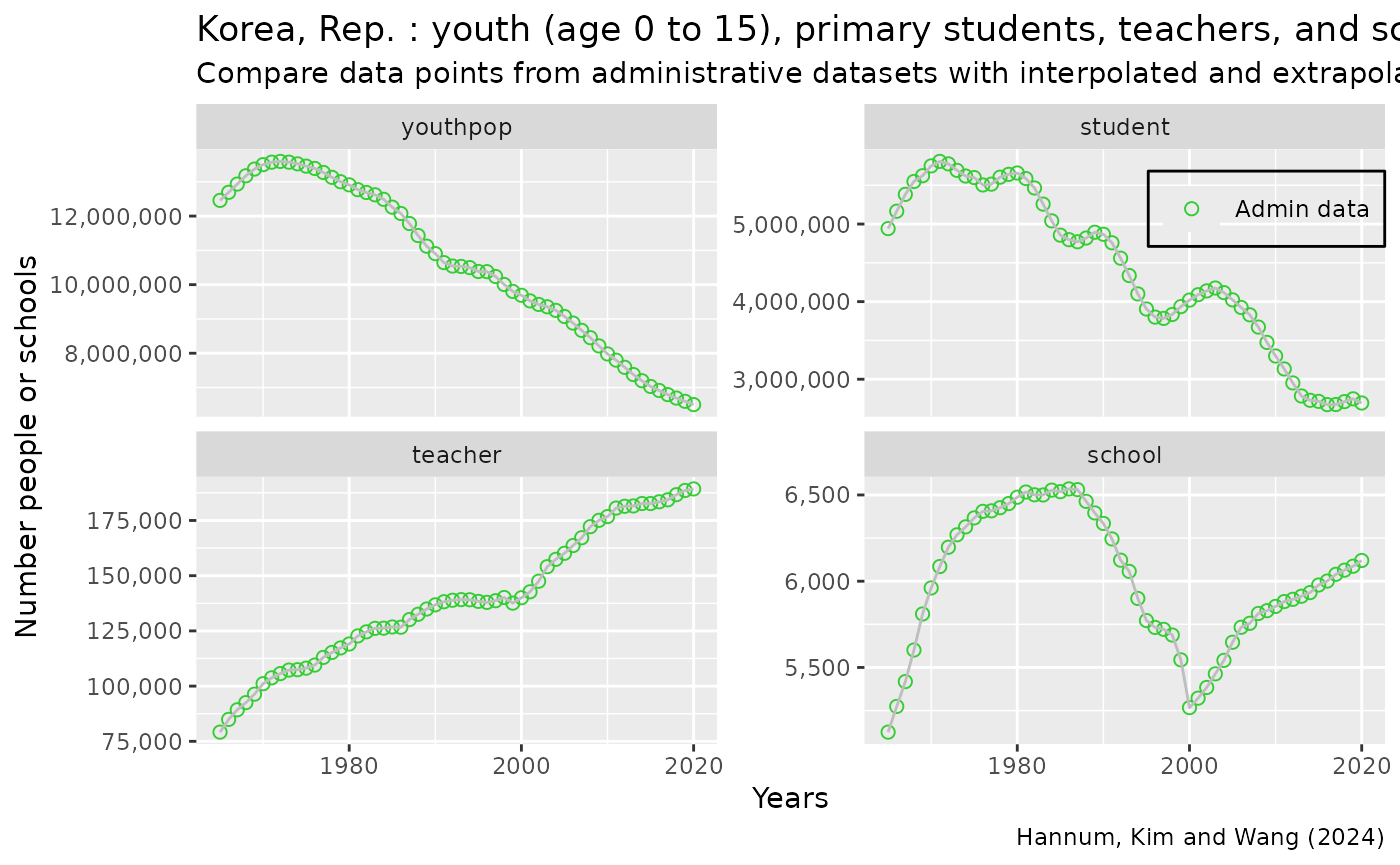
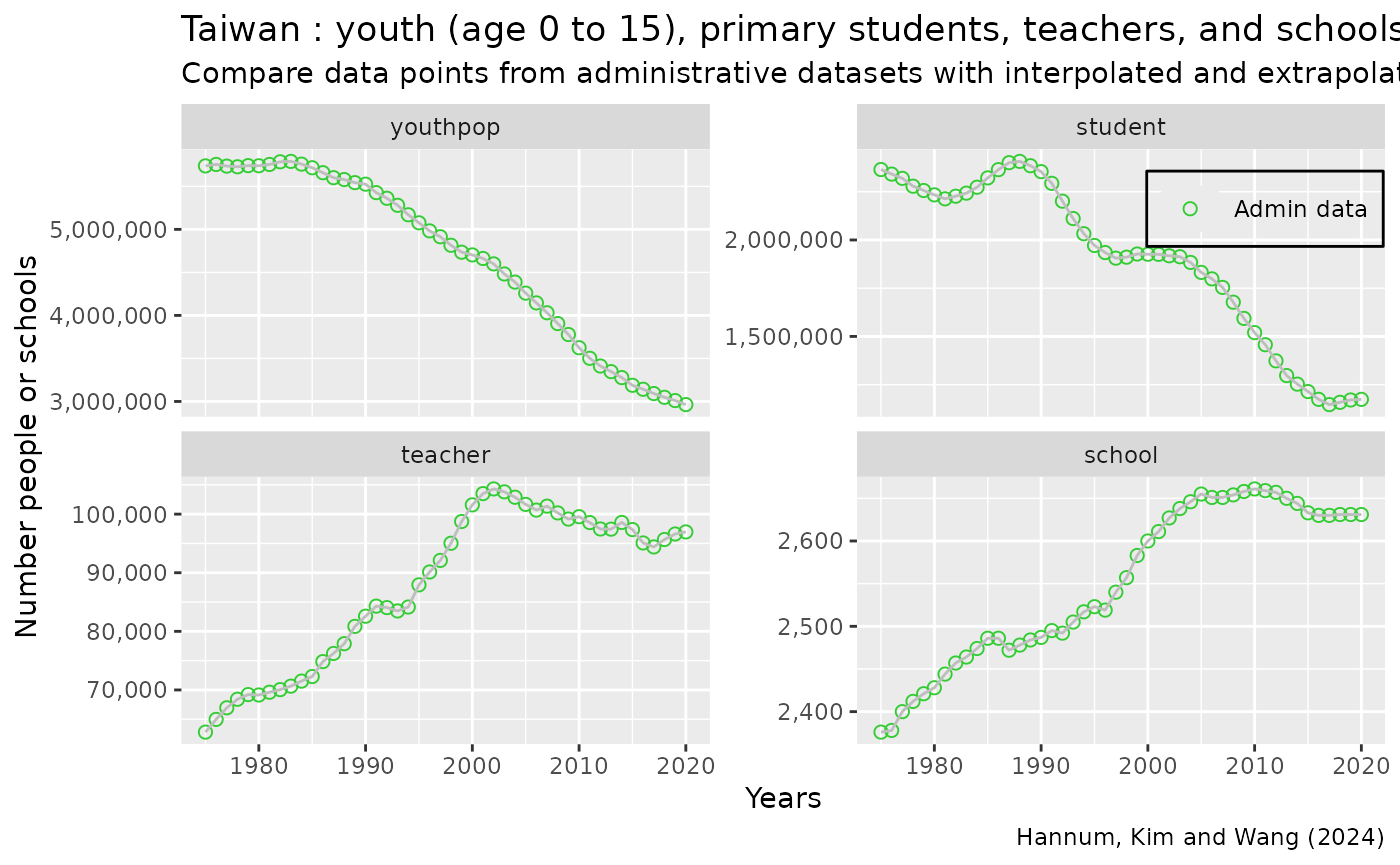
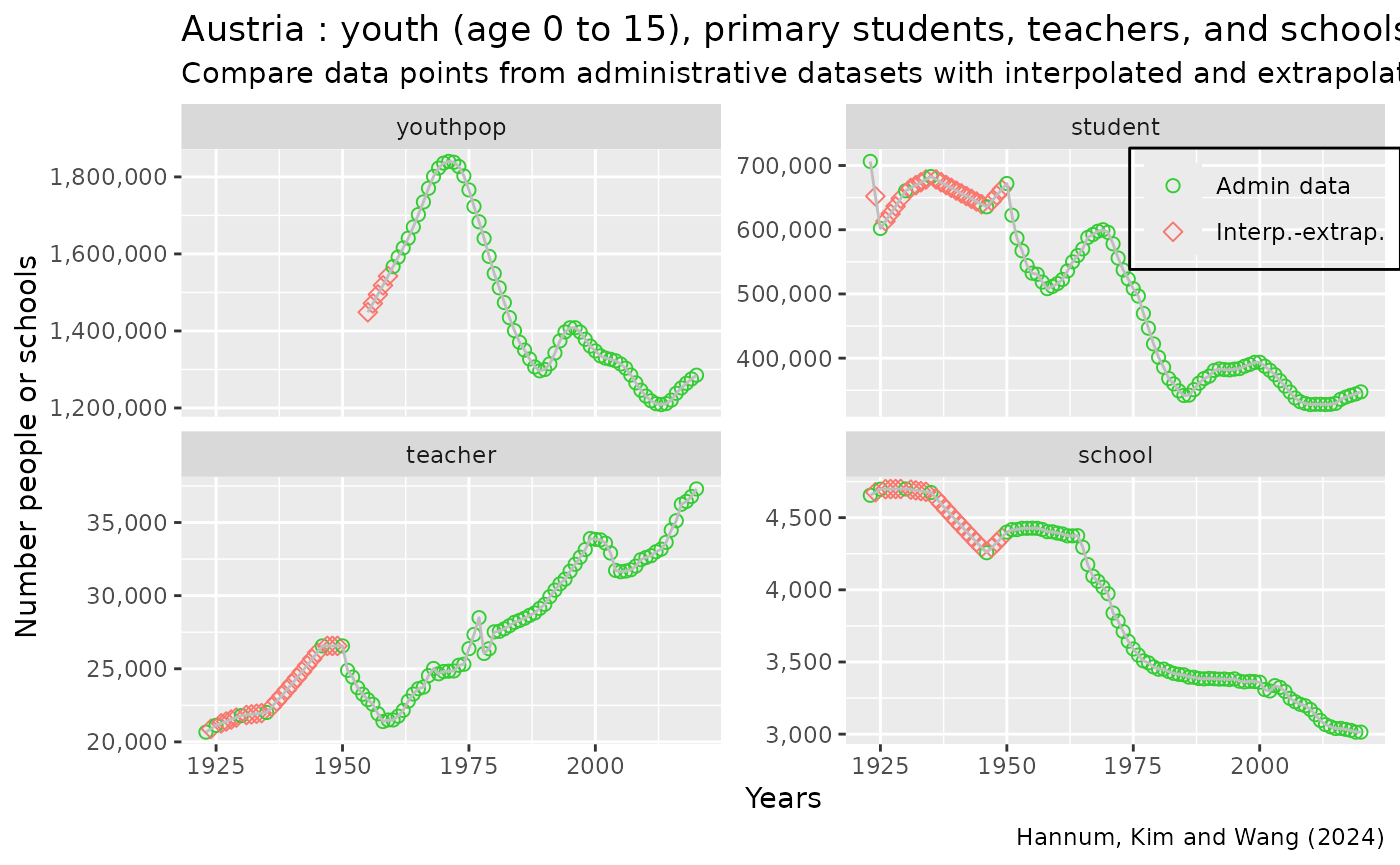
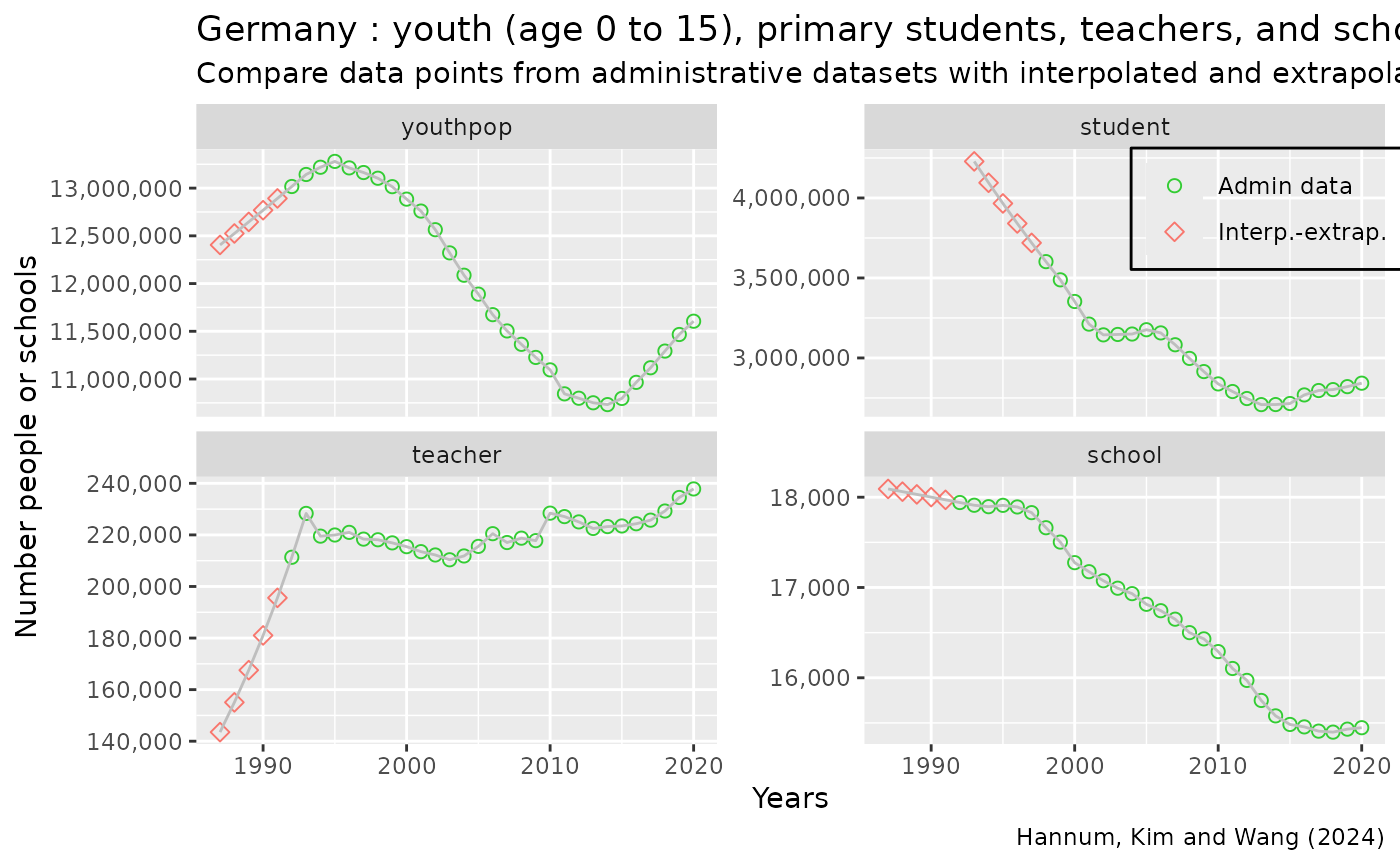
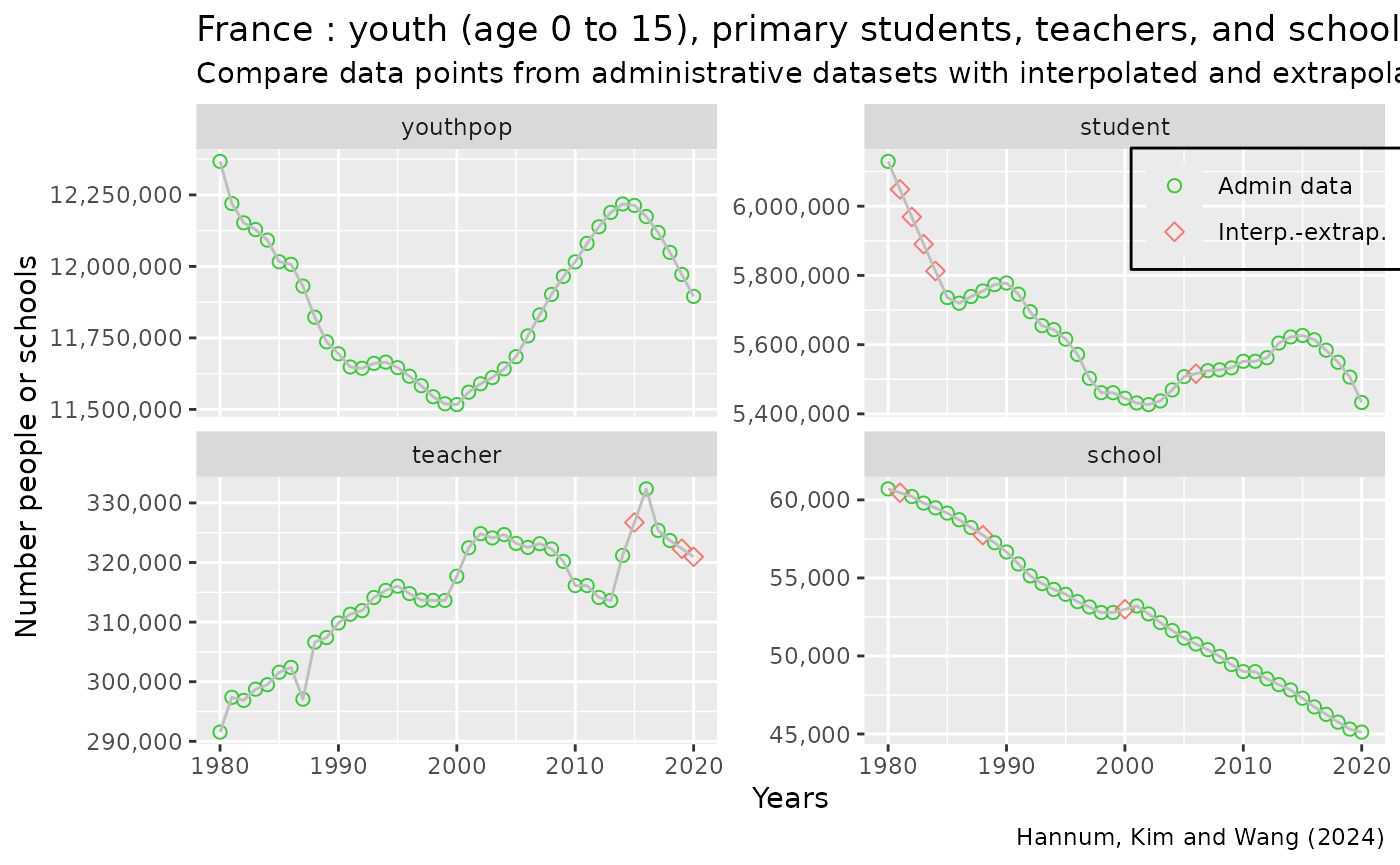
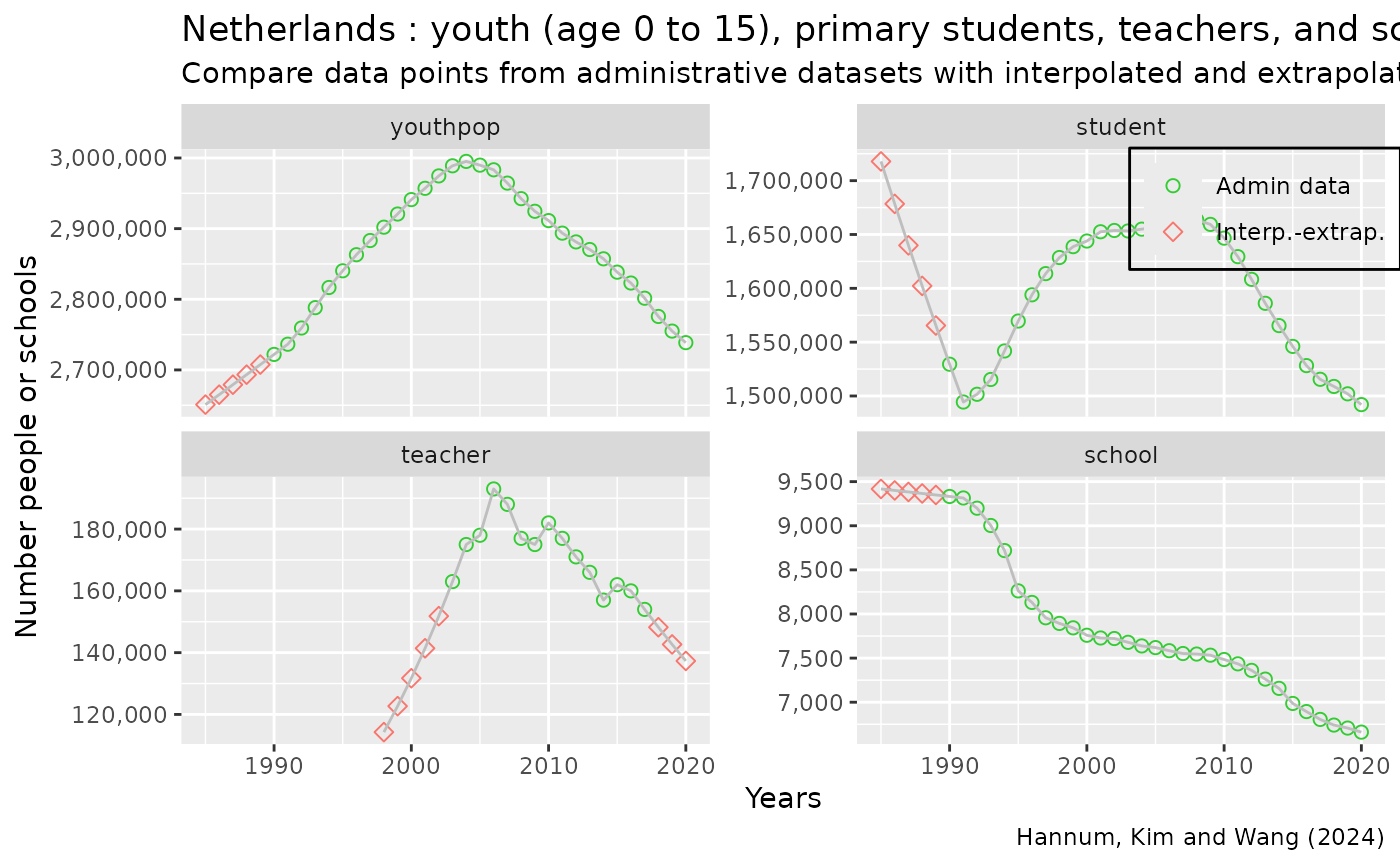
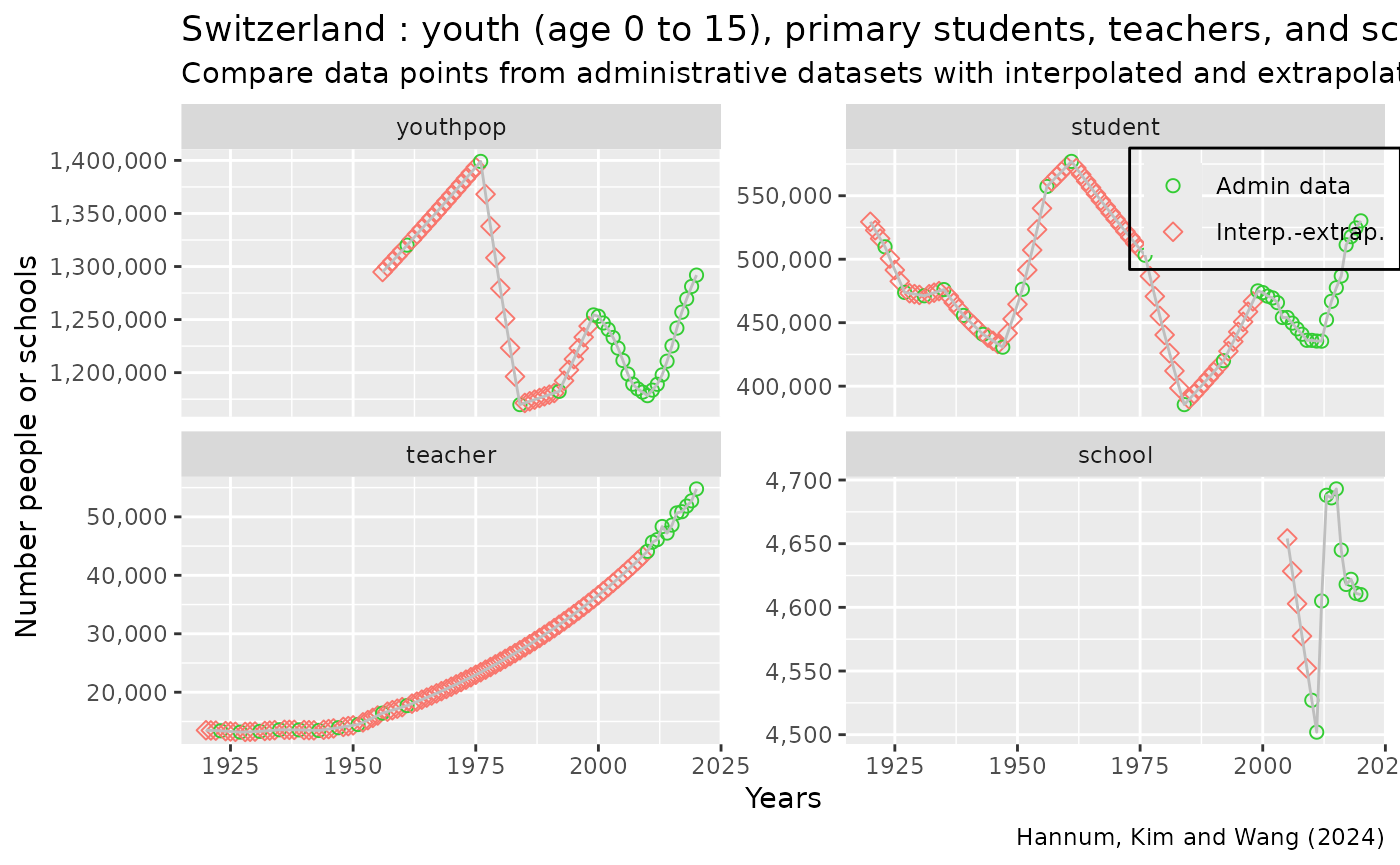
Selected country results
We will have two variables, the variable with the interpolated results along with original raw data, as well as a variable with just the points where interpolation took place. And we will visualize by presenting the full results as a solid line, and the places where interpolation and extrapolation took place as dots.
ppts_pchg <- ppts_pchg %>%
  select(
    location_code,
    variable, year,
    value, value_interp1
  ) %>%
  mutate(
    value_interponly = case_when(
      is.na(value) & !is.na(value_interp1) ~ value_interp1,
      TRUE ~ NA
    )
  )
Interpolated and raw data in the same variable for easier graphing.
ppts_pchg_longer <- ppts_pchg %>%
  select(
    location_code,
    variable, year,
    value, value_interp1, value_interponly
  ) %>%
  rename(
    value_0raw = value,
    value_1interp1 = value_interp1,
    value_2interpoly = value_interponly
    ) %>%
  pivot_longer(cols = starts_with('value'),
              names_to = c('value_type'),
              names_pattern = paste0("value_(.*)"),
              values_to = "value") %>%
  drop_na(value)
print(
  ppts_pchg_longer %>% group_by(value_type) %>% tally()
  )
#> # A tibble: 3 × 2
#>   value_type     n
#>   <chr>      <int>
#> 1 0raw       37430
#> 2 1interp1   44052
#> 3 2interpoly  6622
Graph-generating script
Build a graph generating function to show all data points and interpolated points.
ffi_select_country_show_interpolate <- function(
  st_country_name = "France"
) {
  # Select
  st_location_code <- ppts_country_code_sel %>%
    filter(location_name == st_country_name) %>%
    pull(location_code)
  ppts_pchg_longer_country <- ppts_pchg_longer %>%
    filter(location_code == st_location_code)
  ppts_pchg_country <- ppts_pchg %>%
    filter(location_code == st_location_code)

  # Visualize.
  # Color controls
  ar_st_colors <- c("#33cc33", "#F8766D")
  ar_st_labels <- c("Admin data", "Interp.-extrap.")
  # Shape controls
  ar_it_shapes <- c(1, 5)

  pl_lines_pri <- ggplot() +
    geom_point(
      data = ppts_pchg_longer_country %>% filter(value_type != "1interp1"),
      aes(
        x=year, y=value,
        color=value_type, shape=value_type,
      ), size = 2) +
    geom_line(
      data= ppts_pchg_longer_country %>% filter(value_type == "1interp1"),
      aes(
        x=year, y=value
        ), linewidth = 0.5, color="gray") +
    facet_wrap( ~
      factor(variable, c("youthpop", "student", "teacher", "school")),
      scales = "free_y"
    ) +
    labs(x = paste0("Years"),
        y = paste0("Number people or schools"),
        title = paste(
          st_country_name,
          ": youth (age 0 to 15), primary students, teachers, and schools",
          sep=" "),
        subtitle = paste(
          "Compare data points from administrative datasets",
          "with interpolated and extrapolated data", sep=" "),
        caption = paste(
          "Hannum, Kim and Wang (2024)", sep="")) +
    scale_color_manual(values = ar_st_colors, labels=ar_st_labels) +
    scale_shape_manual(values = ar_it_shapes, labels=ar_st_labels) +
    scale_y_continuous(labels = scales::comma_format(big.mark = ',')) +
    theme(
      text = element_text(size = 11),
      legend.title = element_blank(),
      legend.position = c(0.90, 0.90),
      legend.key.width = unit(1.5, "line"),
      legend.background =
        element_rect(fill = "transparent", colour = "black", linetype='solid')
    )
  return(pl_lines_pri)
}
Administrative data and interpolation in East Asia
ar_st_country_name <- c(
  "China", "Japan", "Korea, Rep.", "Taiwan"
)
for (st_country_name in ar_st_country_name) {
  pl_country <- ffi_select_country_show_interpolate(st_country_name = st_country_name)
  print(pl_country)
}
#> Warning: A numeric `legend.position` argument in `theme()` was deprecated in ggplot2
#> 3.5.0.
#> ℹ Please use the `legend.position.inside` argument of `theme()` instead.
#> This warning is displayed once every 8 hours.
#> Call `lifecycle::last_lifecycle_warnings()` to see where this warning was
#> generated.